In this blog post we will go over some useful tips and tricks for debugging client-side Javascript using the Chrome Dev Tools. We will focus on situations where we actually don’t know where to put the breakpoint in the first place.
Let’s go over the following topics:
- Find out what code is changing a section of the page
- Find out who is doing a certain ajax request
- conditional breakpoints
- event breakpoints
- programmatic breakpoints
- Frequently used Debug snippets
- Add a breakpoint before a given function
- Search an object for matching properties
- Break when an object property is accessed
- Find out who is calling a function using deb.js
The Chrome Dev Tools debugger
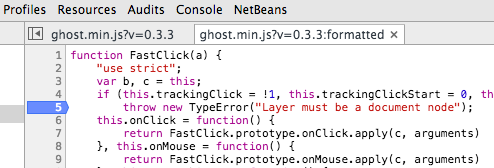
Let’s start by opening the Chrome Dev Tools and setting up a breakpoint. Use the shortcut Ctrl+Shift+I or Cmd+Option+I, then choose the sources tab. Choose a source and set up a breakpoint by clicking on the line number:
The problem is, in many situations we don’t know where to put a breakpoint in the first place. This can happen for example while debugging a program that we didn’t wrote ourselves.
Let’s start by seeing how the Chrome Dev Tools can help in several of these situations.
What code is changing this section of the page?
One common scenario happens when a section of the page is being modified, but its not entirely clear by which part of the code. By pointing and right-clicking the HTML element on the page, it’s possible to setup a breakpoint that will be triggered when that part of the page is modified:
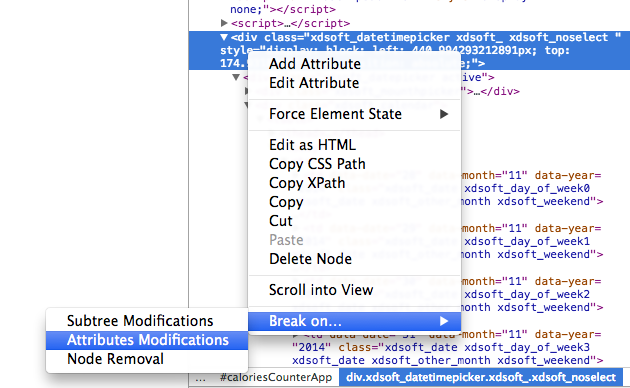
There are three ways to detect modifications on a section of a page:
- subtree modifications: the breakpoint is triggered if the element or any of it’s sub-elements is modified. This is the most frequently option used.
- Attribute modifications: the breakpoint is triggered when an attribute of the element is changed
- Node removal: triggered when the element is removed from the document
Who is doing this Ajax request?
Another situation that can happen is when a certain ajax request is being made, but we are not sure what part of the code is doing it.
To answer that question, on the sources tab there is a XHR breakpoint section, where it’s possible to add Ajax breakpoints by clicking Any XHR:
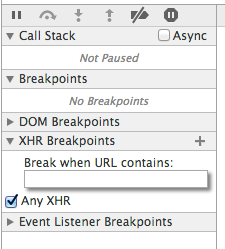
Alternativelly by clicking the plus sign on the section header, it’s possible to add an ajax breakpoint that breaks only if the url of the request contains a matching string.
Conditional breakpoints
Sometimes we don’t want a breakpoint to be triggered every time that the code goes through a given code line. For example, we might want to trigger the breakpoint only if a certain argument of a function (such as an id) has a certain value.
A condition can be added to the breakpoint by right-clicking on the line number and choosing Edit breakpoint:
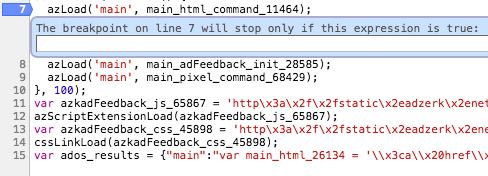
Any condition can be added that uses any of the locally accessible variables.
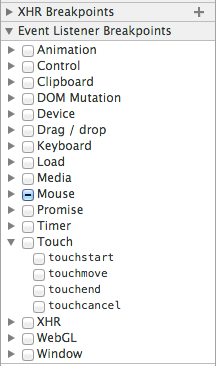
Event breakpoints
Besides Ajax requests, all sort of events might be made to trigger a breakpoint: mouse clicks, double clicks, blur/focus events, setTimeout, etc. These breakpoints can be set in the sources tab, in the Event Listener Breakpoints section:
Programmatic breakpoints
It’s possible to trigger a breakpoint simply by adding the following code line to a Javascript program:
debugger;
When the code reaches this line, the debugger will be triggered just like if a breakpoint was set on that same line.
This functionality is useful for creating debug tools, or as an alternative to manually setting breakpoints.
Frequently used debug snippets
The Chrome Dev Tools give the developer the possibility to save a small script for future use. This functionality is available in the sources tab, on the sub-tab Snippets:
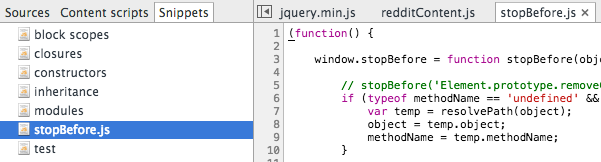
This functionality can be used for storing frequently used debugging snippets, made by you or other developers. Some of the most useful snippets I came across are from Paul Irish (Google Dev Tools evangelist).
By copying those snippets into your Dev Tools, you can have them always accessible from the console and ready to use. Let’s go through some of them in the following sections, and then finish off with deb.js.
Add a breakpoint before a given function
The stopBefore.js allows to setup a breakpoint that is triggered just before a certain function is called. For example, this will trigger a breakpoint just before the document.getElementById function is called:
stopBefore(document, 'getElementById')
Search an object for matching properties
The grep.js snippet allows to search an object and its prototypical chain for properties that match a given search criteria.
For example this instruction will search for all properties matching get in the document object:
grep(document, 'get');
Break when an object property is accessed
The debugAccess.js allows to trigger a breakpoint when a given property is accessed. For example this will trigger a breakpoint each time document.cookie is called:
debugAccess(document, 'cookie');
Find out who is calling a function using deb.js
To finish our tour of Javascript debugging tools and techniques, let’s have a look at deb.js, a minimalistic JavaScript debugging library.
Start by adding the following script to the top of your page, before any other script is loaded:
<script src='deb.min.js'></script>
Then mark a function for being traced by calling .deb()on it:
var calculateSomething = function(cb) {
    // ...
}.deb();
The next time the function is called, the following output is generated to the console:
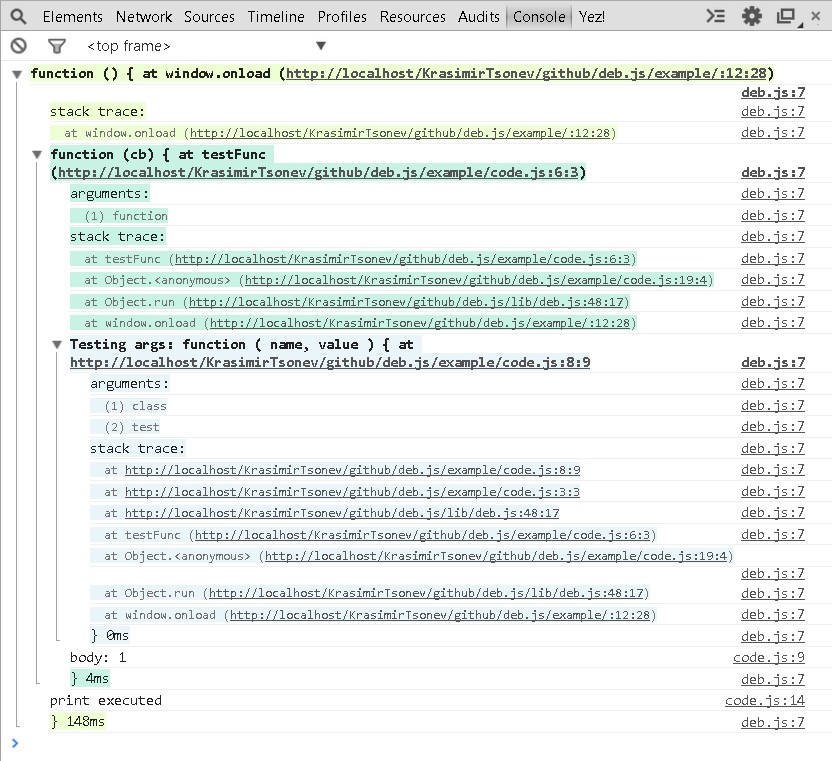
As we can see, deb.js has printed the arguments, the stacktrace of who is calling the function together with the line number of each function call, the return value (if any) and the execution time.
Final Thoughts
These debugging techniques should cover the most frequent troubleshooting scenarios. Depending on the problem, many times it’s better to use console.log instead of using a debugger, especially if the different logging levels are used.
The logging statements can be turned off in production mode, and turned back on to help troubleshoot a given problem.
| Reference: | Javascript debugging tips using the Chrome Dev Tools, deb.js and more from our WCG partner Aleksey Novik at the The JHades Blog blog. |