I’m working on a small weather station project, and I was looking for a way to plot the weather data quickly on a chart.
My first idea was to use the big visualization libraries such as D3.js and Fabrics, but they were way too heavy to get started with for my needs. They can do everything, but I was just looking for a quick chart, not another new framework to learn.
I finally choose to use the Chart.js library (https://www.chartjs.org/). It’s not the smallest library ever at 117.7KB minified and gzipped, but it does pull moment.js as a dependency which account for half the size. Still, for a chart-heavy application such as this one, I’m willing to pay that resource cost. Besides, I’ll be the only one use this application on my own network.
Since it’s a JavaScript library, but not React specific, I wanted to decouple the Chart.js code from the React code. Since Chart.js expects a canvas to render the content; I just added the <canvas> tag to my React component, such as:
<div className="chart-container"
     style={{ position: "relative", height: "60vh", width: "100%" }}>
   <canvas id="myChart"></canvas>
</div>
And imported the JavaScript file containing the Chart.js code so it would initialize the chart (tucked away neatly in a chart folder in my project):
import drawWeatherVisualization from "../../chart/WeatherVisualization.js";
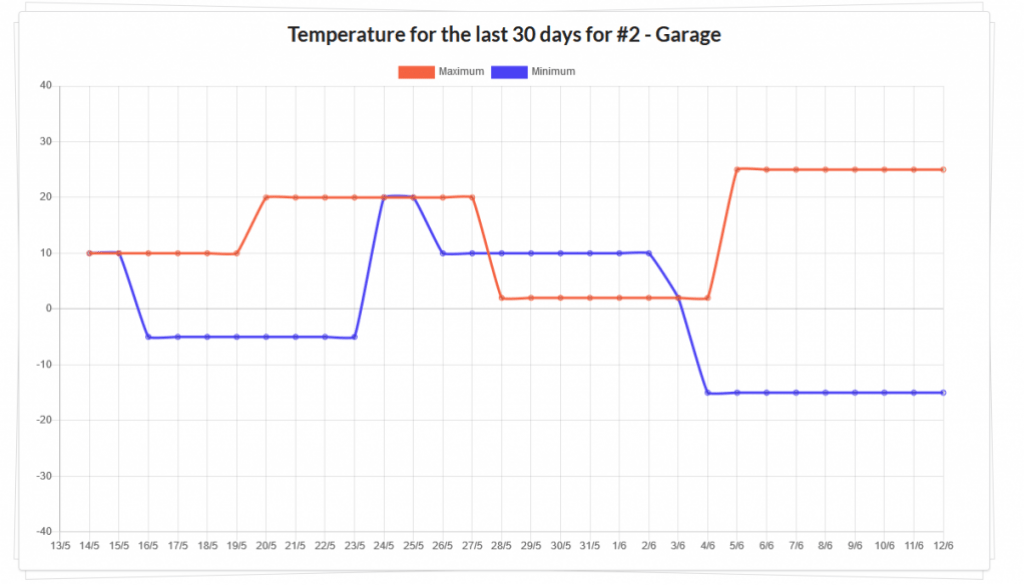
The chart itself is a simple object to which you pass various options. For a line chart like this one, you’ll need to feed it a dataset for each line (using the currentWeatherModule variable from the functional React component pulling this). The dataset will be shown on the Y axis, in that case the minimum and maximum temperature reached for each day in the last 30 days.
const drawWeatherVisualization = async currentWeatherModule => {
    var ctx = document.getElementById("myChart").getContext("2d");
    try {
        response = await axios.get("/api/temperatureHistory?moduleId=" + currentWeatherModule.moduleId);
    } catch (error) {
        console.error(error);
    }
    var myChart = new Chart(ctx, {
        type: "line",
        data: {
        labels: response.data.labels,
        datasets: [
            {
            label: "Maximum",
            data: response.data.maximumTemperatureData,
            fill: false,
            borderColor: "rgb(245, 99, 66)",
            lineTension: 0.1
            },
            {
            label: "Minimum",
            data: response.data.minimumTemperatureData,
            fill: false,
            borderColor: "rgb(75, 66, 245)",
            lineTension: 0.1
            }
        ]
        }
    });
};

export default drawWeatherVisualization;
You also need to set the axis for the data. In my case, I’m generating a list of dates as the X axis, using the moment.js data format.
The minimum and maximum are not necessary; the library can figure it out from the data. For my use case, I want to make sure the display still make sense even if I don’t have data for all 30 days yet and to have always the same axis in all charts.
On the other hand, I forgot to sort the data by date before sending it to Chart.js and I had really strange results. Don’t forget your sorts!
I’m also setting the minimum and maximum weather expected so it looks better and it’s not just an arbitrary number, but it’s not necessary either.
scales: {
    xAxes: [
    {
        type: "time",
        time: {
        unit: "day",
        round: "day",
        displayFormats: {
            day: "D/M"
        },
        ticks: {
            suggestedMin: new Date(new Date() - 30 * 24 * 60 * 60 * 1000),
            suggestedMax: new Date(),
            source: "auto"
        }
        }
    }
    ],
    yAxes: [
    {
        ticks: {
        suggestedMin: -40,
        suggestedMax: 40
        }
    }
    ]
}
Here is the complete code for the line chart with a few more formatting options added in. It’s not perfect, but I’m pretty satisfied at the speed at which I was able to add this in my project. If you want to see the complete project, you can check it out on GitHub (https://github.com/CindyPotvin/temperature-logger).
import Chart from "chart.js";
import axios from "axios";

const drawWeatherVisualization = async currentWeatherModule => {
var ctx = document.getElementById("myChart").getContext("2d");
let response;
try {
    response = await axios.get("/api/temperatureHistory?moduleId=" + currentWeatherModule.moduleId);
} catch (error) {
    console.error(error);
}
var myChart = new Chart(ctx, {
    type: "line",
    data: {
    labels: response.data.labels,
    datasets: [
        {
        label: "Maximum",
        data: response.data.maximumTemperatureData,
        fill: false,
        borderColor: "rgb(245, 99, 66)",
        lineTension: 0.1
        },
        {
        label: "Minimum",
        data: response.data.minimumTemperatureData,
        fill: false,
        borderColor: "rgb(75, 66, 245)",
        lineTension: 0.1
        }
    ]
    },
    options: {
    maintainAspectRatio: false,
    responsive: true,
    layout: {
        padding: {
        right: 40
        }
    },
    scales: {
        xAxes: [
        {
            type: "time",
            time: {
            unit: "day",
            round: "day",
            displayFormats: {
                day: "D/M"
            },
            ticks: {
                suggestedMin: new Date(new Date() - 30 * 24 * 60 * 60 * 1000),
                suggestedMax: new Date(),
                source: "auto"
            }
            }
        }
        ],
        yAxes: [
        {
            ticks: {
            suggestedMin: -40,
            suggestedMax: 40
            }
        }
        ]
    }
    }
});
};

export default drawWeatherVisualization;
Published on Web Code Geeks with permission by Cindy Potvin, partner at our WCG program. See the original article here: Charting data quickly with Chart.js in React Opinions expressed by Web Code Geeks contributors are their own. |