As soon as we deploy any nontrivial web application, or any software application for that matter, we soon (or should) become interested in how this application is performing in the wild. If it’s a web application, we want to know how many requests we are receiving, how much time is spent serving a request on average and so on.
These numbers, more commonly referred to as metrics, help us understand the behavior of our application, identify unexpected behavior, and scale up or down the underlying software infrastructure to ensure the best possible experience for the application’s consumers, as well as utilize the system infrastructure judiciously.
We will be discussing two categories of such metrics in this post: counters and histogram. A counter is a metric that always goes up during the lifetime of a process; the total number of requests served, for example. A histogram is a metric that would be used to record measurements such as request latency and then be analyzed to see the distribution of the latency across configurable buckets.
To learn more about these and other metric types that Prometheus supports, please refer to Prometheus’s metric types document.
A Note about Software Requirements
The sample Python application we will follow along with is tested with Python 3 and may not work with Python 2. In addition, we will be using docker (v1.13) and docker-compose (v1.10.0) to run the web application. If you don’t have these installed, please follow the official guide to install these on your operating system.
All the source code we will need to follow along with is in a git repository.
Our Python Web Application
The category of Python web application that we will be discussing in this post is a WSGI application deployed via uwsgi or gunicorn and running multiple worker processes (specifically, five); in other words, synchronous web applications where multiple requests can be processed by potentially different processes. A web application written using the Django web framework or the microframework Flask is an example of an application of this category.
For the purpose of this post, we will look at a Flask application, in flask_app.py:
from flask import Flask

@app.route('/test/')
def test():
    return 'rest'

@app.route('/test1/')
def test1():
    1/0
    return 'rest'

@app.errorhandler(500)
def handle_500(error):
    return str(error), 500

if __name__ == '__main__':
    app.run()
Requests to the application for “/test/” receive a text “rest” as response, and requests to the application for “/test1/” cause an exception that results in the 500 Internal Server Error. This in turn is returned as a proper, HTTP 500 response with the error returned as a response text.
We will now modify our application above so that it measures the following two things:
- Number of requests it receives and the response status sent
- Time spent by the server for each request
To accomplish these goals, we will implement a new module, middleware, inside a helpers package as follows:
from flask import request
import time
import sys

def start_timer():
    request.start_time = time.time()

def stop_timer(response):
    resp_time = time.time() - request.start_time
    sys.stderr.write("Response time: %ss\n" % resp_time)
    return response

def record_request_data(response):
    sys.stderr.write("Request path: %s Request method: %s Response status: %s\n" %
            (request.path, request.method, response.status_code))
    return response

def setup_metrics(app):
    app.before_request(start_timer)
    # The order here matters since we want stop_timer
    # to be executed first
    app.after_request(record_request_data)
    app.after_request(stop_timer)
We will then modify our web application to import the setup_metrics function and call it as follows:
from helpers.middleware import setup_metrics

app = Flask(__name__)
setup_metrics(app)
Now, if we run our web application and make a few requests, we will see the above information being printed like so:
Response time: 0.023952245712280273s
Request path: /test Request method: GET Response status: 301


Response time: 0.0126190185546875s
Request path: /test1/ Request method: GET Response status: 500
If you need to refer to how the web application looks at this stage, see this commit.
Exporting Prometheus Metrics
The Prometheus monitoring system differs from most other similar software in at least one way. Instead of the application pushing metrics to the monitoring system, Prometheus scrapes the application via HTTP usually on the /metrics/ endpoint.
Our next step is to add this endpoint to our web application to expose the calculated metrics in a format understood by Prometheus by using the Promethus Python client.
We will add a new route for our web application as follows:
CONTENT_TYPE_LATEST = str('text/plain; version=0.0.4; charset=utf-8')
..
@app.route('/metrics/')
def metrics():
    return Response(prometheus_client.generate_latest(), mimetype=CONTENT_TYPE_LATEST)
The generate_latest() function generates the latest metrics and sets the content type to indicate the Prometheus server that we are sending the metrics in text format using the 0.0.4 version.
However, the real work of setting the metrics happens in our middleware module. We have introduced two major changes, the first of which is initializing objects of two metric types: Counter and Histogram.
from prometheus_client import Counter, Histogram

REQUEST_COUNT = Counter(
    'request_count', 'App Request Count',
    ['app_name', 'method', 'endpoint', 'http_status']
)
REQUEST_LATENCY = Histogram('request_latency_seconds', 'Request latency',
    ['app_name', 'endpoint']
)
The first argument while creating the objects above is the name of the metric, followed by a description of what it refers to. The third argument is a list of labels associated with the metric.
We can think of labels as metadata we attach to the metric, which are stored along with the value of the metric. For the request_count metric, we attach the application name (app_name) so that our application is uniquely identifiable, the HTTP method (method) of the current request, the endpoint (endpoint) for which the request was made, and the response status(http_status).
For the request_latency metric, we attach the labels, app_name, and endpoint.
Then in our functions where we calculated the metrics, we have replaced our earlier sys.stderr.write() statements with the following:
def stop_timer(response):
    resp_time = time.time() - request.start_time
    REQUEST_LATENCY.labels('test_app', request.path).observe(resp_time)
    return response

def record_request_data(response):
    REQUEST_COUNT.labels('test_app', request.method, request.path,
            response.status_code).inc()
    return response
To record a new “observation” for a Histogram metric (REQUEST_LATENCY above), we call the observe() method with the desired value of the observation. For a Counter metric (REQUEST_COUNT above), we call the inc() method.
In both cases, we call the labels() method to specify the value of each label that the current observation will be associated with. The order of these values must be the same as that of the corresponding keys when the metric was created. We can also specify the label values using keyword arguments.
The source code for the updated application is in the flask_app_prometheus sub-directory, and you can see the README to learn more about the infrastructure used to deploy the application.
Spinning up the Prometheus server
Next, we will use docker-compose to start our web application and a Prometheus server. The Prometheus server is configured to scrape our web application at regular intervals (15 seconds):
$ cd flask_app_prometheus
$ docker-compose -f docker-compose.yml -f docker-compose-infra.yml up
..
Once docker-compose finishes bringing up the services, you will see logs like this in the window:
webapp           | [pid: 13|app: 0|req: 13/117] 172.22.0.3 () {34 vars in 549 bytes} [Mon May  1 22:21:33 2017] GET /metrics => generated 261 bytes in 2 msecs (HTTP/1.1 301) 3 headers in 134 bytes (1 switches on core 0)
webapp           | [pid: 13|app: 0|req: 15/119] 172.22.0.3 () {34 vars in 549 bytes} [Mon May  1 22:21:38 2017] GET /metrics => generated 261 bytes in 2 msecs (HTTP/1.1 301) 3 headers in 134 bytes (1 switches on core 0)
webapp           | [pid: 14|app: 0|req: 17/121] 172.22.0.3 () {34 vars in 549 bytes} [Mon May  1 22:21:43 2017] GET /metrics => generated 261 bytes in 2 msecs (HTTP/1.1 301) 3 headers in 134 bytes (1 switches on core 0)
This is Prometheus scraping our web application for gathering the metrics. Let’s send a few requests to our web application as well via curl:
$ curl 127.0.0.1:5000/

<title>404 Not Found</title>
<h1>Not Found</h1>
<p>The requested URL was not found on the server.  If you entered the URL manually please check your spelling and try again.</p>

$ curl 127.0.0.1:5000/test/
rest

$ curl 127.0.0.1:5000/test1/
division by zero

$ curl 127.0.0.1:5000/test1

<title>Redirecting...</title>
<h1>Redirecting...</h1>
<p>You should be redirected automatically to target URL: <a href="http://127.0.0.1:5000/test1/">http://127.0.0.1:5000/test1/</a>.  If not click the link.%                          ➜
Now, let’s go to the Prometheus expression browser at http://127.0.0.1:9090/graph and type in one of the two metrics we exported. For “request_count”, you will see a graph similar to the following:
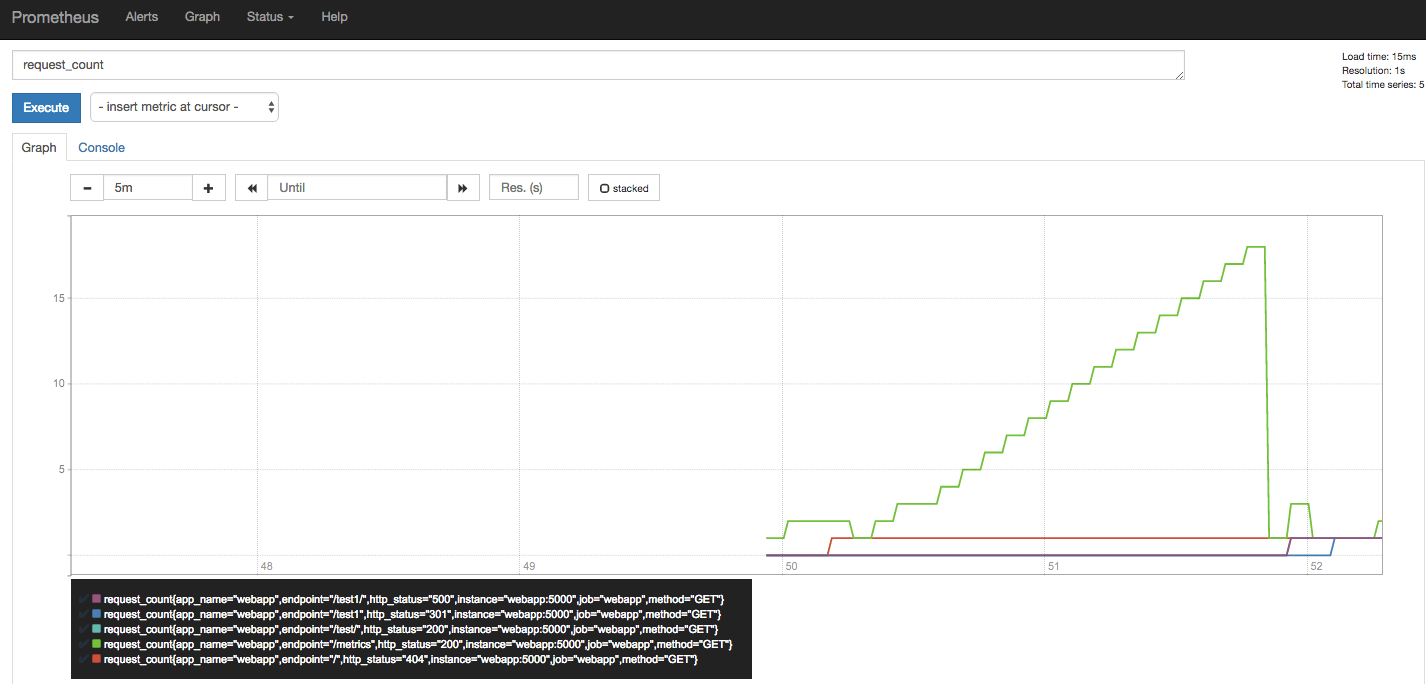
Prometheus metrics exported directly
At the bottom left, we can see that each combination of the values of the labels we added has created a different metric. This is also the reason the Prometheus documentation advises using labels wisely.
We can use these labels to filter the metric we are interested in and create a dashboard showing only one or more of these metrics. For example request_count{http_status="500"} will only show the requests that were unsuccessful with a 500 HTTP status code. To learn more about querying Prometheus, see the querying Prometheus documentation.
Limitations to native exporting
Let’s go back to our above graph. How does the value of the metric request_count ever go down?
The answer is in how our Python application is running: via uwsgi, and we are running five worker processes completely independent of each other. When Prometheus makes an HTTP request to our web application’s /metrics endpoint, any of these workers can handle the request. Hence, the metrics reported by that worker is only valid for itself. This is a generic issue for Python applications deployed as independent worker processes(in fact, Ruby too) and therefore a number of solutions are being investigated by the community.
I’ll describe the solution that I think is the most straightforward next.
Pushing statsd Metrics
Instead of Prometheus scraping our Python web application directly, we will let each worker process push its metrics to a certain “bridge” application, which will then convert these individual data points into aggregated metrics. These aggregated metrics will then be converted into Prometheus metrics when Prometheus queries the bridge.
This “bridge” application here is the statsd exporter. The idea is that we will modify our middleware module to push the metrics in a [statsd] compatible format to this bridge instead:
[Python Web application Worker]

[Python Web application Worker]   - > [Statsd Exporter]    <- [Prometheus]

[Python Web application Worker]
The key changes to the middleware module are as follows:
from datadog import DogStatsd


statsd = DogStatsd(host="statsd", port=9125)
REQUEST_LATENCY_METRIC_NAME = 'request_latency_seconds'
REQUEST_COUNT_METRIC_NAME = 'request_count'

def stop_timer(response):
    resp_time = time.time() - request.start_time
    statsd.histogram(REQUEST_LATENCY_METRIC_NAME,
            resp_time,
            tags=[
                'service:webapp',
                'endpoint: %s' % request.path,
                ]
    )
    return response

def record_request_data(response):
    statsd.increment(REQUEST_COUNT_METRIC_NAME,
            tags=[
                'service: webapp',
                'method: %s' % request.method,
                'endpoint: %s' % request.path,
                'status: %s' % str(response.status_code)
                ]
    )
    return response
We are making use of Datadog’s extensions to statsd to add tags, which is why we are using the statsd client from the datadog client to push the statsd metrics. Tags are strings of the form key:value and correspond to Prometheus labels.
The source code for the updated application is in the flask_app_statsd_prometheus sub-directory.
Setting up statsd bridge for Prometheus
If you haven’t terminated the services we started earlier, press Ctrl+C in the window where we started the service and that will terminate the services and stop the containers.
Next, we will use docker-compose once again to start our web application, the statsd exporter, and our Prometheus server:
$ cd flask_app_statsd_prometheus
$ docker-compose -f docker-compose.yml -f docker-compose-infra.yml up
If you encounter errors such as Cannot create container for service webapp, you can remove it using docker rm webapp and then attempt to run docker-compose again.
Once all the services are up, we can test if our web application is up and running once again by making HTTP GET requests as we did earlier.
The statsd_exporter by default appends the metric type to the metric name when it exports it to Prometheus. Therefore, if we now go to the Prometheus expression browser at http://127.0.0.1:9090/graph and type in one of the two metrics we exported after appending the metric type, request_count_counter, we will see a graph similar to the following:
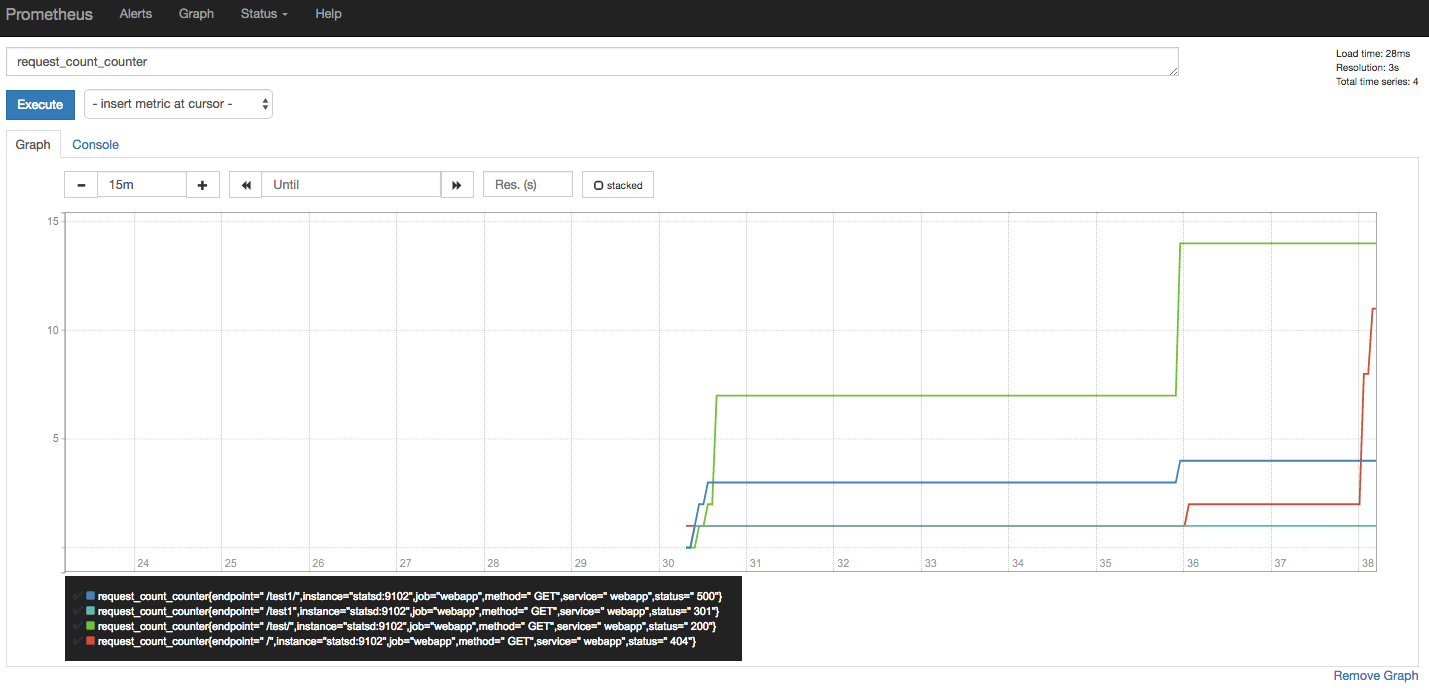
Prometheus metrics via statsd exporter
Try making a few more requests, and we will not see the counter ever coming down.
Conclusion
In this post, we saw how we can set up our synchronous Python web application to calculate metrics and use Prometheus to aggregate them for us. We first saw an approach using the native Prometheus client, but considering the limitation it suffers from, we used a straightforward second approach to eliminate that limitation.
Although we used Flask as the web framework of choice, the concepts should translate equally well to another web framework, provided it is deployed as a WSGI application with multiple independent workers.
My approach in this post has not been to use any third-party extensions that would automatically do the job of creating and pushing the metrics. As a result, we have implemented the middleware ourselves. However, the following packages may be of interest:
In a follow-up post, we will see how we can integrate Prometheus with asynchronous Python web applications.
Resources
| Reference: | Monitoring Your Synchronous Python Web Applications Using Prometheus from our WCG partner Amit Saha at the Codeship Blog blog. |