Hopefully, from the first post in this two-part series, you’ve got a good sense of the type of information included in Ruby heap dumps and how to dig into it. Now we’ll generate a heap dump off of a Heroku dyno and analyze it.
To begin, you’ll need a production app running on Heroku, an AWS account, and S3 credentials for storing the dump information.
If you don’t have an app you want to debug yet, you can use my open source app codetriage.com.
Heap Dump Concepts on Heroku
Before we get to the code, we need to understand some core features of Heroku. Each dyno is ephemeral, and you can’t modify it while it is running. This is amazing for stability, but can be frustrating when you’re trying to debug problem that only shows up in production.
The other key point is that tracing object allocations is expensive (slow); writing a heap dump to disk and uploading it to S3 is also expensive. Due to this, we want to only run our tracing code on one dyno, so we’re only slowing down a fraction of our web requests.
If your app has only one running dyno, I would recommend increasing the count while you’re debugging. Otherwise your users might be stuck with long load times or a broken experience. If you’re close to your memory limits, you might also consider upgrading to the next sized dyno. For example, if you’re running on 1x dynos with 512mb of RAM, consider bumping it up to 2x dynos for the duration of your experiments. The tracing and dumping will use some system resources, and you don’t want them to impact your end user.
Generating a heap dump in Ruby will store all retained strings in plain text. This likely includes all sensitive strings such as your service or database credentials. After taking a heap dump off of a production service, be careful who you share the file with.
Running Code on a Select Number of Dynos
To help with isolating your code to only one dyno, I wrote a simple library called the lone dyno. It looks at your ENV['DYNO'] environment variable and only runs on the number of dynos you specify.
We’ll also need a way to trigger our heap dumps. For that, I’m using Postgres’ listen/notify feature. It’s a way to send messages without having to create a custom table to write and read from. To help out there, The Lone Dyno uses another small lib to help with listen/notify called hey you.
If you’re using the Puma web server, you’ll get the most data by tracing allocations on your cluster workers instead of on the master process. We can enable tracing on these by utilizing the on_worker_boot blocks in your config/puma.rb file:
on_worker_boot do
  # Worker specific setup for Rails 4.1+
  # See: https://devcenter.heroku.com/articles/deploying-rails-applications-with-the-puma-web-server#on-worker-boot
  ActiveRecord::Base.establish_connection
end
You’ll need to make sure you’ve got AWS_ACCESS_KEY_ID and AWS_SECRET_ACCESS_KEY set in your app. Add the lone dyno and aws gems to your Gemfile:
gem 'the_lone_dyno'
gem 'aws-sdk', '~> 2'
I also created a bucket just for heap dumps in S3 and assigned it to AWS_S3_BUCKET_NAME.
Here’s the final code we’ll use to trace allocations and trigger heap dumps:
on_worker_boot do
  ActiveRecord::Base.establish_connection

  TheLoneDyno.exclusive do |signal|
    puts "Running on DYNO: #{ENV['DYNO']}"

    require 'objspace'
    require 'tempfile'

    ObjectSpace.trace_object_allocations_start
    signal.watch do |payload|
      puts "Got signal #{ payload.inspect}"
      Tempfile.open("heap.dump") do |f|

        ObjectSpace.dump_all(output: f)
        f.close

        s3 = Aws::S3::Client.new(region: 'us-east-1')
        File.open(f, 'rb') do |file|
          s3.put_object(body: file, key: "#{Time.now.iso8601}-process:#{Process.pid}-heap.dump", bucket: ENV['AWS_S3_BUCKET_NAME'])
        end
      end
    end
  end
end
Verify if everything works locally before deploying to production. I recommend using a .env file and the dotenv gem locally to set your AWS credentials.
You can test by spinning up your server with this:
$ env DYNO=web.1 bundle exec bin/puma -C config/puma.rb
This will trick The Lone Dyno into thinking you’re running on Heroku, and you should see debug output when your server boots.
[86337] * Listening on tcp://0.0.0.0:3000
[86337] Use Ctrl-C to stop
Running on DYNO: web.1
[86337] - Worker 0 (pid: 86338) booted, phase: 0
[86337] - Worker 1 (pid: 86339) booted, phase: 0
Running on DYNO: web.1
You should see Running on DYNO: web.1 for each worker process you’re using. In another terminal tab, you can trigger a heap dump:
$ rails c
irb(main):001:0> TheLoneDyno.signal("thundercats are go")
NOTIFY web_1the_lone_dyno_hi_ho_silver, 'thundercats are go'
You may have to wait up to 60 seconds (the default sleep duration for checking for signals), but you should see another debug output when the server gets the signal.
Got signal "thundercats are go"
Once you see this output, check your S3 contents in the browser to make sure a file was uploaded correctly. If you download it locally, you can preview the contents using the $ less command:
$ less 2015-11-08T20-30-42+00-00-process-878-heap.dump
Make sure it looks like the sample heap dump contents at the beginning of the article. Once you’ve confirmed, everything is wired up. Verify you’ve set the correct config $ heroku config, commit to git, then deploy.
Once you’ve deployed, you can either manually trigger a dump…
$ heroku run bash
rails c
Running bash on issuetriage... up, run.5749
rails c
~ $ rails c
Loading production environment (Rails 4.2.5.rc1)
irb(main):001:0> TheLoneDyno.signal("Do you want to join my professional network on linkedin")
… or you can set up a scheduler task to take a heap dump every hour. You should see an S3 entry for every worker process that you’re running. If you’ve got four workers, you’ll generate four files.
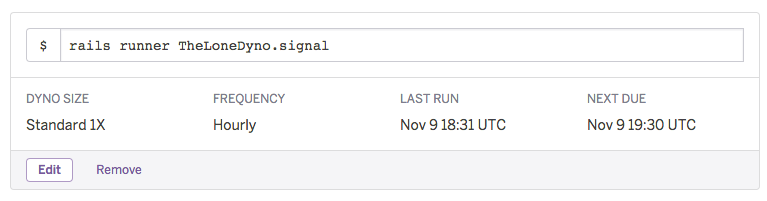
When you first deploy, your heap dump will be fairly small. As the process runs over time, the heap dumps will be larger. I’m using the scheduler method, so I can retroactively look at a time when the memory use was high. To get this information, I use Heroku metrics:
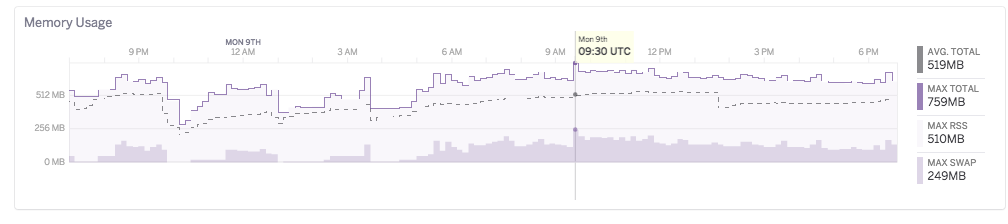
Note the high swap due to a perf regression (more on that later).
Analyzing Production Dump
After running for a while, my heap dump was around 500mb. Using the $ heapy command, we can see it has quite a bit more information than our example script.
$ heapy read 2015-11-08T20-30-42+00-00-process-878-heap.dump
Generation: nil object count: 195095
Generation: 134 object count: 1637
Generation: 135 object count: 18852
Generation: 136 object count: 47628
Generation: 137 object count: 18216
Generation: 138 object count: 3183
Generation: 139 object count: 2055
Generation: 140 object count: 1673
Generation: 141 object count: 158
Generation: 142 object count: 246
Generation: 147 object count: 4
Generation: 148 object count: 84
Generation: 149 object count: 214
Generation: 153 object count: 142
Generation: 154 object count: 300
Generation: 160 object count: 2
Generation: 162 object count: 13
Generation: 163 object count: 3
Generation: 164 object count: 2
Generation: 167 object count: 4
Generation: 168 object count: 6
Generation: 170 object count: 6999
Generation: 171 object count: 4379
Generation: 172 object count: 5125
Generation: 180 object count: 86
Generation: 191 object count: 544
Generation: 192 object count: 126380
Generation: 193 object count: 49298
Generation: 194 object count: 25
Generation: 195 object count: 1178
Generation: 198 object count: 6
Generation: 199 object count: 2
Generation: 200 object count: 2
Generation: 201 object count: 2
Generation: 203 object count: 6
Generation: 204 object count: 2
Generation: 207 object count: 8
Generation: 208 object count: 4
Generation: 210 object count: 4
Generation: 211 object count: 2
Generation: 212 object count: 6
Generation: 213 object count: 7
Generation: 214 object count: 233611
Generation: 215 object count: 80430
STOPPED HERE
The “nil” count is much higher, but in this case, we can somewhat ignore these since the memory increase happens gradually over time and not right at boot. You’ll see that we have long periods of small object counts, then spikes with larger counts. These spikes are likely where our memory use is coming from.
Debugging in a heap dump is a bit like looking for a needle in a haystack where the needle might be made out of hay.
Taking a look at the data, keep asking yourself why something might be in memory. Once you’ve figured out why, then ask if it needs to be in memory. For example, I looked at some of the smaller generations: 198 to 213. When I dug into those generations, I saw some innocent looking output:
$ heapy read 2015-11-08T20-30-42+00-00-process-878-heap.dump 211
# ...

Duplicate strings
==============================

 1  "\"$user\",public-SELECT  \"issues\".* FROM \"issues\" WHERE \"issues\".\"repo_id\" = $1 AND \"issues\".\"state\" = $2  ORDER BY created_at DESC LIMIT 20 OFFSET 260"
 1  /app/vendor/bundle/ruby/2.2.0/gems/activerecord-4.2.5.rc1/lib/active_record/connection_adapters/postgresql_adapter.rb:193

 1  "a32"
 1  /app/vendor/bundle/ruby/2.2.0/gems/activerecord-4.2.5.rc1/lib/active_record/connection_adapters/postgresql_adapter.rb:185
At first glance, this seems innocuous. It makes sense that there would be SQL strings still in memory. However, these were from an older generation — why would they be kept around? Let’s look at that second string “a32” location:
class StatementPool < ConnectionAdapters::StatementPool
  def initialize(connection, max)
    super
    @counter = 0
    @cache   = Hash.new { |h,pid| h[pid] = {} }
  end

  def each(█); cache.each(█); end
  def key?(key);    cache.key?(key); end
  def [](key);      cache[key]; end
  def length;       cache.length; end

  def next_key
    "a#{@counter + 1}"
  end
It comes from the next_key in the Postgres statement pool. This is the class that Rails uses to generate prepared statements.
The idea is that once you create a prepared statement, instead of having to send over query and bind values, you can send over a prepared statement key and just the bind values. Since you’re sending less data, it’s faster. Also, this tells Postgres that you’ll be making that query again so it can optimize it.
This capacity is built to help your app run faster, but it is limited. Postgres cannot store an infinite number of prepared statements, and this also takes up memory on your app. For that reason, Rails limits the number of prepared statements it will cache to 1,000 prepared statements.
Now that we know why that string is in memory, does it make sense that we should be retaining a reference to it? (Hint: I probably wouldn’t be asking if the answer was “yes”).
The problem with that SQL query is that it has data directly in the limit and offset. Postgres doesn’t know that a query with DESC LIMIT 20 OFFSET 260 and DESC LIMIT 40 OFFSET 40 are the same thing but with different pagination, so it creates two different prepared statements. This takes up extra memory in Postgres and eats up lots of slots in our limited prepared statement cache.
Instead, we should be using bind values like:
"\"$user\",public-SELECT \"issues\".* FROM \"issues\" WHERE \"issues\".\"repo_id\" = $1 AND \"issues\".\"state\" = $2 ORDER BY created_at DESC LIMIT $ OFFSET $"
If we used this string instead, Rails can then reuse one prepared statement for each paginated query instead of the many it was creating. I proposed this change in issue #22250 and it’s currently being worked on by @sgrif.
hbspt.cta.load(1169977, ‘11903a5d-dfb4-42f2-9dea-9a60171225ca’);
App Level Issues
In the last example, we saw an issue with a library we are using: Active Record. As I mentioned before, heap dumps can be cryptic. Looking at the larger generations or the entire dump with all, we can see where a large amount of memory was allocated:
$ heapy read 2015-11-08T20-30-42+00-00-process-878-heap.dump all

allocated by memory (141114900) (in bytes)
==============================
  42278576  /app/vendor/bundle/ruby/2.2.0/gems/activerecord-4.2.5.rc1/lib/active_record/result.rb:116
  34566467  /app/vendor/bundle/ruby/2.2.0/gems/activerecord-4.2.5.rc1/lib/active_record/connection_adapters/postgresql/database_statements.rb:168
  11026240  /app/vendor/bundle/ruby/2.2.0/gems/activerecord-4.2.5.rc1/lib/active_record/attribute_set/builder.rb:32
  10999680  /app/vendor/bundle/ruby/2.2.0/gems/activerecord-4.2.5.rc1/lib/active_record/core.rb:549
   6083752  /app/vendor/bundle/ruby/2.2.0/gems/activerecord-4.2.5.rc1/lib/active_record/core.rb:114
   4930472  /app/vendor/bundle/ruby/2.2.0/gems/activerecord-4.2.5.rc1/lib/active_record/associations.rb:162
   3801600  /app/vendor/bundle/ruby/2.2.0/gems/activerecord-4.2.5.rc1/lib/active_record/attribute_set/builder.rb:18
   3480056  /app/vendor/bundle/ruby/2.2.0/gems/activerecord-4.2.5.rc1/lib/active_record/attribute.rb:5
   3150960  /app/vendor/bundle/ruby/2.2.0/gems/rack-timeout-0.3.2/lib/rack/timeout/support/scheduler.rb:72
   1901360  /app/vendor/bundle/ruby/2.2.0/gems/activesupport-4.2.5.rc1/lib/active_support/core_ext/numeric/conversions.rb:131
   1900800  /app/vendor/bundle/ruby/2.2.0/gems/activerecord-4.2.5.rc1/lib/active_record/attribute_set/builder.rb:19
   1900800  /app/vendor/bundle/ruby/2.2.0/gems/activerecord-4.2.5.rc1/lib/active_record/core.rb:548
   1900800  /app/vendor/bundle/ruby/2.2.0/gems/activerecord-4.2.5.rc1/lib/active_record/core.rb:556
   1895600  /app/vendor/bundle/ruby/2.2.0/gems/activerecord-4.2.5.rc1/lib/active_record/attribute_set/builder.rb:100

# ...
We see that on active_record/result.rb:116 we allocated the most amount of memory. Does this mean we found another problem with Active Record? Let’s keep digging. We can see where the highest number of objects were referenced:
# ...

High Ref Counts
==============================

  1190545  /app/vendor/bundle/ruby/2.2.0/gems/activerecord-4.2.5.rc1/lib/active_record/result.rb:116
  260712  /app/vendor/bundle/ruby/2.2.0/gems/activerecord-4.2.5.rc1/lib/active_record/connection_adapters/postgresql/database_statements.rb:168
  190225  /app/vendor/bundle/ruby/2.2.0/gems/activerecord-4.2.5.rc1/lib/active_record/core.rb:114
  190080  /app/vendor/bundle/ruby/2.2.0/gems/activerecord-4.2.5.rc1/lib/active_record/attribute_set/builder.rb:18
  189665  /app/vendor/bundle/ruby/2.2.0/gems/activerecord-4.2.5.rc1/lib/active_record/associations.rb:162
  145797  /app/vendor/bundle/ruby/2.2.0/gems/activerecord-4.2.5.rc1/lib/active_record/attribute.rb:5
   96668  /app/vendor/bundle/ruby/2.2.0/gems/activerecord-4.2.5.rc1/lib/active_record/attribute_set/builder.rb:32
   47520  /app/vendor/bundle/ruby/2.2.0/gems/activerecord-4.2.5.rc1/lib/active_record/attribute_set/builder.rb:19

# ...
Wow, so the highest reference count objects were also allocated on the same line. Surely this is a bug in Active Record.
Nope.
It so happens that I cheated a bit and know exactly where the performance regression came from. I purposefully reintroduced memory bloat into codetriage so that I could see what it looks like with a heap dump.
That second line in Active Record is where all database objects are allocated:
def exec_query(sql, name = 'SQL', binds = [])
  execute_and_clear(sql, name, binds) do |result|
    types = {}
    fields = result.fields
    fields.each_with_index do |fname, i|
      ftype = result.ftype i
      fmod  = result.fmod i
      types[fname] = get_oid_type(ftype, fmod, fname)
    end
    ActiveRecord::Result.new(fields, result.values, types) # <==== This is connection_adapters/postgresql/database_statements.rb:168
So what’s happening is that we were allocating one Repo object from the database; the bulk of this object is created when we call ActiveRecord::Result.new. The problem is that the includes(:issues) on the query was also creating thousands of issue records that weren’t being used.
This one Repo object holds the reference to all these thousands of issues. For each of those Issue objects, they’re allocated in roughly the same spot: ActiveRecord::Result.new. So what our heap dump is saying that not only does the bulk of our memory come from Active Record, it is also referenced by another Active Record object. Maybe it’s not a smoking gun, but it is more information that we had before.
There are cases that are a little more clear. For example, Sam Saffron used heap dumps to debug Discourse to great result. In his case, the problem was in message_builder.rb, and the heap data showed that as a prime place to start looking:
9  /var/www/discourse/lib/email/message_builder.rb:85
6  /var/www/discourse/vendor/bundle/ruby/2.2.0/gems/actionview-4.1.9/lib/action_view/template.rb:297
6  /var/www/discourse/lib/email/message_builder.rb:36
6  /var/www/discourse/lib/email/message_builder.rb:89
6  /var/www/discourse/lib/email/message_builder.rb:46
6  /var/www/discourse/lib/email/message_builder.rb:66
One other thing he noticed was that Ruby Racer was generating a lot of objects:
72  /var/www/discourse/vendor/bundle/ruby/2.2.0/gems/therubyracer-0.12.1/lib/v8/weak.rb:21
72  /var/www/discourse/vendor/bundle/ruby/2.2.0/gems/therubyracer-0.12.1/lib/v8/weak.rb:42
Once he identified that, he reproduced the memory growth behavior and used [memory_profiler][12] to isolate the source of the objects. I recommend you do the same. You can also use [derailed_benchmarks][13] to run memory_profiler against your whole Rails app by simulating requests.
To Dump or Not to Dump
Taking a heap dump might not point directly to your problem, but it will give you more information than you had before. Use those clues to build different hypotheses and then test them out with scripts or other memory debugging tools.
Another heap visualization tool is tenderlove’s not very good heap analyzer, an online JS-based analyzer.
The memory tooling in the Ruby community has improved dramatically since Ruby 2.1 thanks to all involved. Let’s use these tools to the best of their abilities; the more community knowledge we generate and share around debugging memory, the more robust we can make our tools.
| Reference: | The Definitive Guide to Ruby Heap Dumps, Part II from our WCG partner Florian Motlik at the Codeship Blog blog. |