In my last post, we looked at how you can dig into memory “leaks” on Heroku. These techniques all work well if you can reproduce the memory bloat locally. When you can’t, we can take a “heap dump” off of a running production server and analyze it for more information.
In this two-post series, we’ll look at the basics of what a heap dump is, what the contents look like, how to analyze one, and how to take a heap dump in production. Feel free to skip a section if you’re already familiar with the concepts.
What Is a Heap Dump?
A heap dump is a file that contains a representation of every Ruby object in memory. To generate one, we need to first tell MRI to trace object allocations:
require 'objspace'

ObjectSpace.trace_object_allocations_start
Note: All Ruby examples in this post are 2.2.3
Once you’ve done this, you can generate a file that contains newline-separated JSON objects where each object represents a Ruby object that was allocated. To generate this heap dump file, you can run the following:
file = File.open("/tmp/heap.dump, 'w')
ObjectSpace.dump_all(output: file)
file.close
Note: It is important to always close the heap dump file after writing to it. Otherwise the last line of the file may be mangled, making it impossible for an analysis tool to parse.
What’s Inside a Heap Dump?
Once you take a heap dump, you can inspect all the objects that have ever been in Ruby’s memory.
$ cat /tmp/heap.dump
{"address":"0x7f9539028188", "type":"STRING", "class":"0x7f95390e0ee0", "frozen":true, "embedded":true, "fstring":true, "bytesize":9, "value":"target_os", "encoding":"UTF-8", "memsize":40, "flags":{"wb_protected":true, "old":true, "long_lived":true, "marked":true}}
{"address":"0x7f95390281d8", "type":"STRING", "class":"0x7f95390e0ee0", "embedded":true, "bytesize":7, "value":"245_foo", "encoding":"US-ASCII", "file":"scratch.rb", "line":9, "generation":4, "memsize":40, "flags":{"wb_protected":true, "old":true, "long_lived":true, "marked":true}}
Manually inspecting this file might be of some interest, but we really need to aggregate information to make use of this data. Before we do that, let’s look at some of the keys in the generated JSON.
- generation: The garbage collection generation where the object was generated
- file: The file where the object was generated
- line: The line number where the object was generated
- address: This is the memory address of the object
- memsize: The amount of memory the object consumes
- references: The memory addresses of other objects that this object retains
There are other keys, but that’s enough for now. It’s worth noting that several of these are optional. For example if an object was generated before you started tracing object allocations, it won’t contain generation, file, or line information.
From Dump to Data
Before we can do anything interesting with a heap dump, we’ll need a way to analyze the data. For that, I wrote a barebones CLI called heapy. To understand how to use this tool, we’ll install it, generate a very simple heap dump, and analyze it.
First, let’s install the tool:
$ gem install heapy
Now we need to generate some objects and dump them to disk. To do this, you can run this script:
require 'objspace'

ObjectSpace.trace_object_allocations_start

count = (ARGV.first || 5_000 ).to_i

ARRAY = []
count.times do |x|
  a = "#{x}_foo"
  ARRAY << a
end

file_name = "/tmp/#{Time.now.to_f}-heap.dump"

file = File.open(file_name, 'w')
ObjectSpace.dump_all(output: file)
file.close

puts "heapy read #{file_name}"
In this script, we are looping to allocate strings and storing them to a constant that will never be garbage collected. This is a simulation of a very basic memory leak.
I recommend you save this script to disk. I stored mine at /tmp/scratch.rb and executed it via $ ruby /tmp/scratch.rb. If you try to run it in IRB or another interactive Ruby shell, you’ll get a lot of junk objects since the shell requires objects to function.
$ ruby /tmp/scratch.rb
heapy read /tmp/1446224175.392672-heap.dump
Now we can run that command to get a basic count of objects per generation:
$ heapy read /tmp/1446224175.392672-heap.dump

Analyzing Heap
==============
Generation: nil object count: 7401
Generation:   5 object count: 20008
Congrats! You just analyzed your first heap dump. What does this mean? Don’t worry if your numbers don’t line up perfectly. The “nil” generation means these objects were allocated before we enabled allocation tracing.
This output is showing that we allocated 7,401 objects before we began tracing allocations. After this, we allocated 20,008 objects during fifth generation or the fifth time that Ruby’s garbage collector ran a full mark and sweep.
Nil Generation
In the above example, our “nil” generation count was fairly low at 7,401. However, sometimes it can be really high and skew analysis. For example, if we had to use Active Support in our script, and it started with this:
require 'rubygems'
require 'active_support'

require 'objspace'

ObjectSpace.trace_object_allocations_start

# Rest of script
Then we would see many more objects allocated before tracing started:
Analyzing Heap
==============
Generation: nil object count: 39503
Generation:  11 object count: 10034
If you need to capture the maximum number of allocations possible, you can put your allocation code in a separate file and execute it before running your script.
$ echo "require 'objspace'; ObjectSpace.trace_object_allocations_start" > trace.rb
Now, run the same command using -I to add the current directory to the load path and -r to require our file before running the script.
$ ruby -I . -r trace.rb scratch.rb
heapy read /tmp/1447092518.631352-heap.dump

Analyzing Heap
==============
Generation: nil object count: 7389
Generation:   4 object count: 1060
Generation:   5 object count: 7004
Generation:   6 object count: 4544
That’s much nicer. Since our script for this article doesn’t do much work before we start tracing allocations, we won’t use this technique for the sake of simplicity.
Digging into a Generation
Once we see general allocation counts, we can dig into aggregate measures of a generation. To do this, you can pass in a number at the end of the heapy call. For example, this will show detailed information about objects allocated in the fifth generation:
$ heapy read /tmp/1446224175.392672-heap.dump 5
You can also see all results by using “all.”
$ heapy read /tmp/1446224175.392672-heap.dump all

allocated by memory (858199) (in bytes)
==============================
  767720  scratch.rb:9
   89712  scratch.rb:7
     464  scratch.rb:17
     176  scratch.rb:14
     127  scratch.rb:16

object count (19201)
==============================
  19193  scratch.rb:9
      3  scratch.rb:14
      2  scratch.rb:17
      2  scratch.rb:16
      1  scratch.rb:7

High Ref Counts
==============================

  10000  scratch.rb:7
      2  scratch.rb:17
      1  scratch.rb:14
NOTE: Your output might differ; this library is young and will evolve over time (even as I’m writing this article).
This is a more useful information than the first command. We can see the most aggregate allocated memory occurred on line 9. This is also where we’ve allocated the largest number of objects:
a = "#{x}_foo"It’s also useful to see what object retains the most other objects. In this case, an object is allocated on line 7 and contains references to 10,000 objects. It’s no surprise that this is our array:
ARRAY = []
The important thing to remember is that we record when the object was allocated, not when it was assigned. If I were looking at the script, I would ideally like a red flag on this line:
ARRAY << a
However, there are no objects allocated on this line so it doesn’t show up in our heap dump. We have to infer that this is where the references are getting added by noting where objects are created and what lines reference large numbers of objects.
This means when we’re hunting for memory problems. Heap dumps are more of a tool for finding bread crumbs than smoking guns.
Retained or Allocated or Both?
Ruby only includes the objects that have not been garbage collected in a heap dump. When you take a heap dump, you may get different results depending on if a garbage collection just ran or if it hasn’t run in a long time.
If you’re hunting for a memory leak, it won’t matter. You should be able to see allocated objects readily in your heap dumps since they haven’t been cleared.
However, if you’re looking for memory bloat, where lots of objects intermittently are created, you may get a heap dump right after they were cleared via a GC. To get a “clean” heap dump, you could manually force a GC by running GC.start before generating the heap dump. For example, if the script didn’t retain memory but simply created and discarded it:
require 'objspace'

ObjectSpace.trace_object_allocations_start

count = (ARGV.first || 5_000 ).to_i

def allocate_objects(count)
  array = []
  count.times do |x|
    a = "#{x}_foo"
    array << a
  end
  return nil
end

allocate_objects(count)

file_name = "/tmp/#{Time.now.to_f}-heap.dump"

file = File.open(file_name, 'w')

GC.start
ObjectSpace.dump_all(output: file)
file.close

puts "heapy read #{file_name}"
When we run this, we see that almost no objects are left in the heap.
$ ruby scratch.rb 20_000
heapy read /tmp/1447433325.440035-heap.dump

Analyzing Heap
==============
Generation: nil object count: 7399
Generation:   5 object count: 1
Generation:   8 object count: 2
Generation:   9 object count: 2
If you take out the GC.start, you’ll get a heap with lots of temporary objects:
$ ruby scratch.rb 20_000
heapy read /tmp/1447433430.98191-heap.dump

Analyzing Heap
==============
Generation: nil object count: 7399
Generation:   4 object count: 806
Generation:   5 object count: 10917
Generation:   6 object count: 5468
Generation:   7 object count: 1335
Generation:   8 object count: 1482
If you’re not getting enough temporary object information, you could GC.disable for a period of time and then GC.enable after generating a heap dump.
Be careful though; your memory use could skyrocket if you don’t enable quickly. Instead, I would recommend generating multiple heap dumps at different times.
More Objects, More GC
We can run this same script and generate more objects by passing in an argument. As you saw before, we’ll get more generations in our output:
$ ruby /tmp/scratch 20_000

Analyzing Heap
==============
Generation: nil object count: 7395
Generation:   4 object count: 250
Generation:   5 object count: 11191
Generation:   6 object count: 5605
Generation:   7 object count: 1433
Generation:   8 object count: 1530
What is happening here? Ruby is trying to allocate objects, and it runs out of space. It tries to claim unused objects, however, while the loop is running, it can’t get rid of any of those strings. So, it has to ask the OS for more memory so the program can continue to run. It repeats this process several times.
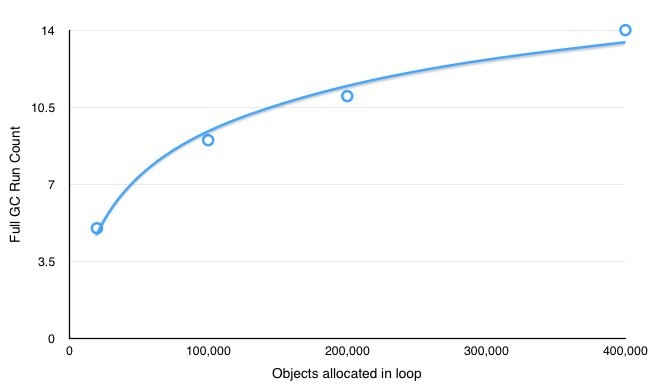
If you continue to increase the number of allocated objects, you can see that the total number of GC runs decreases in relation to object count over time. This is because, every time Ruby asks the OS for more memory, it asks a percentage of its current size. Since the total size is going up, it asks for larger and larger chunks.
Here you can see this relation graphed:
Stay tuned for Part Two of “The Definitive Guide to Ruby Heap Dumps.
| Reference: | The Definitive Guide to Ruby Heap Dumps, Part I from our WCG partner Florian Motlik at the Codeship Blog blog. |