Xdebug is one of the most known PHP extensions, a very complete and powerful debugger. This tutorial will show you how to use it in combination with PhpStorm, probably the most used PHP IDE; and Docker, the archi-known contanerization software.
This would allow us to simply write a Dockerfile with all the Xdebug configuration, and being able to easily deploy our Xdebug server anywhere.
For this tutorial, Linux Mint 18, Docker 1.12.3 and PhpStorm 2016.3.2 have been used.
You may skip environment installation and jump directly to the beginning of the tutorial below.
1. Installation
1.1. Docker
Note: Docker requires a 64-bit system with a kernel version equal or higher to 3.10.
We can install Docker simply via apt-get, without the need of adding any repository, just installing the docker.io package:
sudo apt-get update
sudo apt-get install docker.io
For more details, you can follow the Install Docker on Ubuntu Tutorial.
1.2. PhpStorm
We can download PhpStorm from JetBrains official site. Unfortunately, PhpStorm is not free, but it comes with an evaluation key for a 30 day free trial.
After downloading the tar.gz file, the only thing we have to do is uncompress it, place the folder in the directory we want to have PhpStorm (e.g., in $HOME), and execute the bin/phpstorm.sh file.
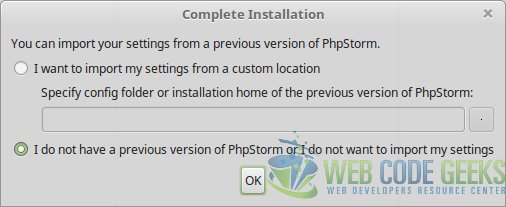
The first thing is to select whether to import settings from previous PhpStorm versions or not, as shown in the image below.
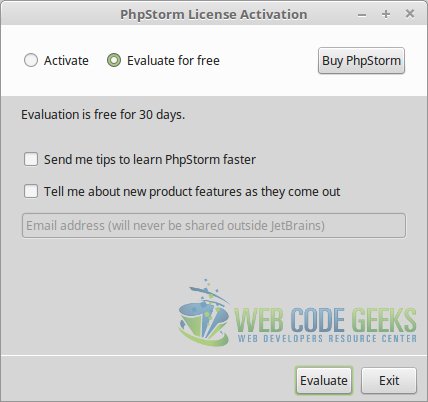
In the next screen, we must choose the “Evaluate for free” option (only just if we don’t have a license, of course).
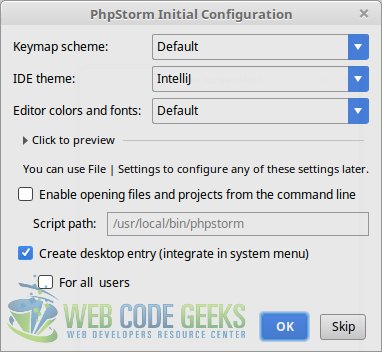
After agreeing the terms of use of PhpStorm, the setup ends with the initial configuration screen. The most important option here is “Create desktop entry (integrate in system menu)”, for being able to start PhpStorm from the menu, instead of having to execute the script as made before.
2. Creating the PhpStorm project
Before starting with the Docker container, we should first create the PhpStorm project, because for the container creation we will need the path to it.
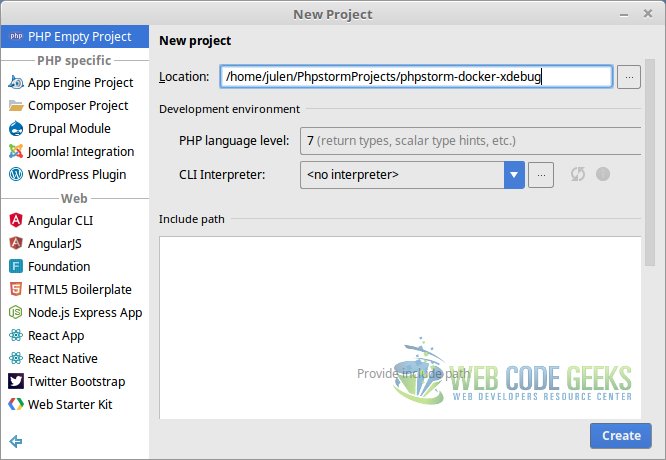
Creating a project is as simple as opening PhpStorm and selecting “Create new project”. We will have to choose the PHP version (the same as the one running within the container), and the location for the project.
3. Creating the PHP container
For creating the container, we will create a Dockerfile based on the official PHP image, in combination with Apache as web server; and installing and enabling Xdebug. Such Dockerfile will consist on:
Dockerfile
FROM php:7.0-apache

ENV DEBIAN_FRONTEND=noninteractive

RUN pecl install xdebug

RUN docker-php-ext-enable xdebug
RUN echo "zend_extension=/usr/local/lib/php/extensions/no-debug-non-zts-20151012/xdebug.so" >> /usr/local/etc/php/conf.d/docker-php-ext-xdebug.ini
RUN echo "xdebug.remote_enable=on" >> /usr/local/etc/php/conf.d/docker-php-ext-xdebug.ini
RUN echo "xdebug.remote_autostart=true" >> /usr/local/etc/php/conf.d/docker-php-ext-xdebug.ini
RUN echo "xdebug.remote_handler=dbgp" >> /usr/local/etc/php/conf.d/docker-php-ext-xdebug.ini
RUN echo "xdebug.remote_mode=req" >> /usr/local/etc/php/conf.d/docker-php-ext-xdebug.ini
RUN echo "xdebug.remote_port=10000" >> /usr/local/etc/php/conf.d/docker-php-ext-xdebug.ini
RUN echo "xdebug.remote_log=/var/log/xdebug_remote.log" >> /usr/local/etc/php/conf.d/docker-php-ext-xdebug.ini
RUN echo "xdebug.idekey=PHPSTORM" >> /usr/local/etc/php/conf.d/docker-php-ext-xdebug.ini
RUN echo "xdebug.remote_connect_back=Off" >> /usr/local/etc/php/conf.d/docker-php-ext-xdebug.ini
The docker-php-ext-enable xdebug creates the config file for Xdebug; then, we throw the configuration for it to the file where is created. Note that we chose the port 10000 for Xdebug, and PHPSTORM for IDE key..
We can build the image just running.
docker build --tag=myphp . # Path to the Dockerfile.
For creating the container, we need the IP address of the host, since Xdebug needs the remote host IP, which will be passed to the container as environmental variable. In my case, the IP address is 172.16.209.148.
As said before, we also need the path of the project in the host, in order to map with the web directory in the container.
Taking all this into account, we would create the container executing:
docker run -p 8080:80 -d --name=myphp1 -e XDEBUG_CONFIG="remote_host=172.16.209.148" -v /home/julen/PhpstormProjects/phpstorm-docker-xdebug:/var/www/html myphp
Note that we have mapped container’s port 80 to host’s 8080, to avoid conflicts in the case of having some web server running in the host.
Now, we should be able to access the web server running in the container with the URL http://localhost:8080/ (even if we get a 403 error).
4. Configuring access to Xdebug to PhpStorm
The next step is to make PhpStorm know how to use Xdebug.
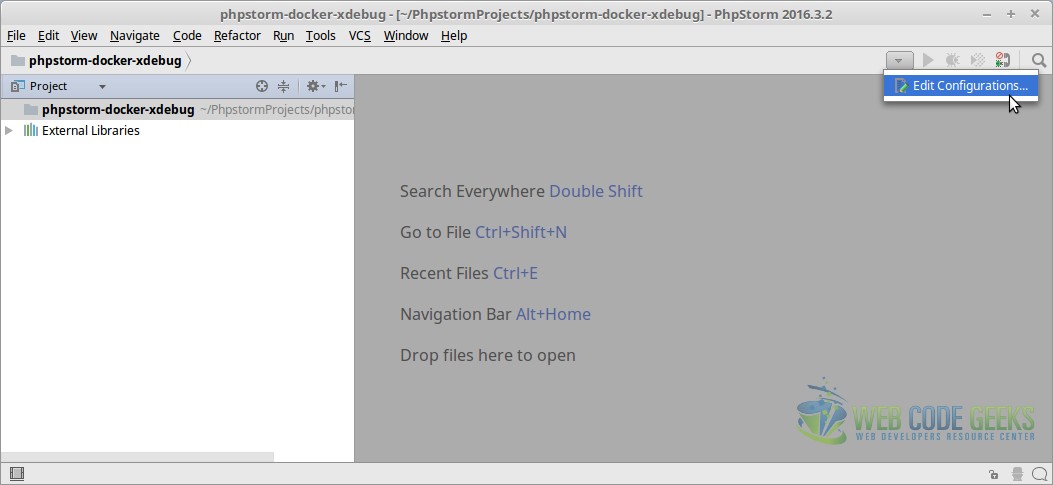
For that, we have to click in the arrow placed in the right-top corner of the IDE, and select “Edit Configurations”.
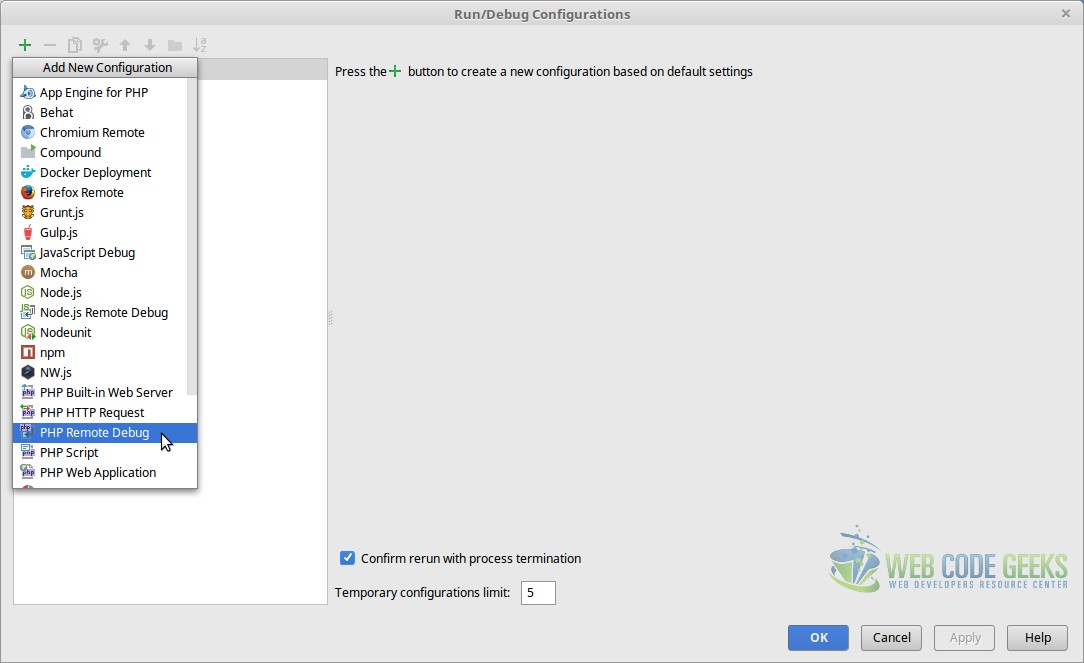
In the new window, we have to click the green arrow, and select “PHP Remote Debug”.
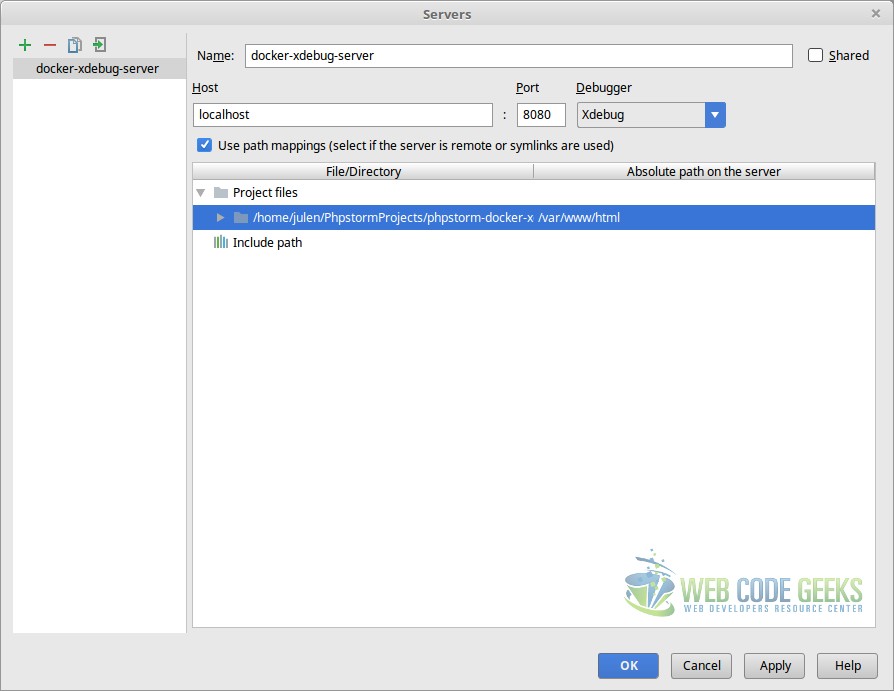
Now, we have to create a new server, clicking in the three dots in the “Servers” section. Here we have to set a name, the host the server is running (the container in localhost), and the port (8080, the exposed port to the host). We also have to set the web path of the server, which is /var/www/html.
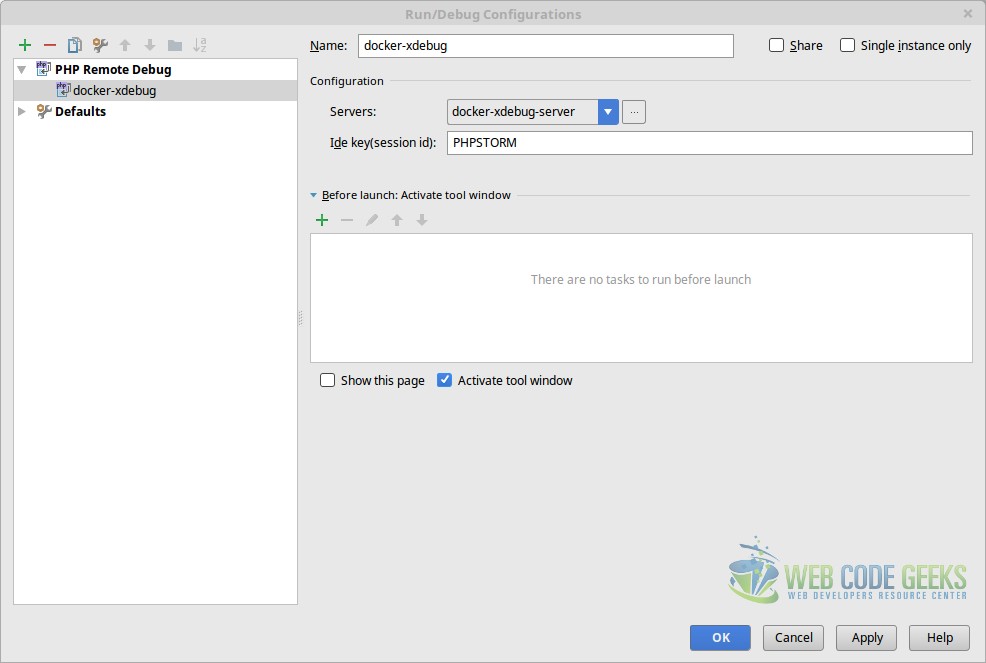
Having the server configured, we just have to select it in the debug configuration, and specify the IDE key set in the Dockerfile for the Xdebug configuration, PHPSTORM:
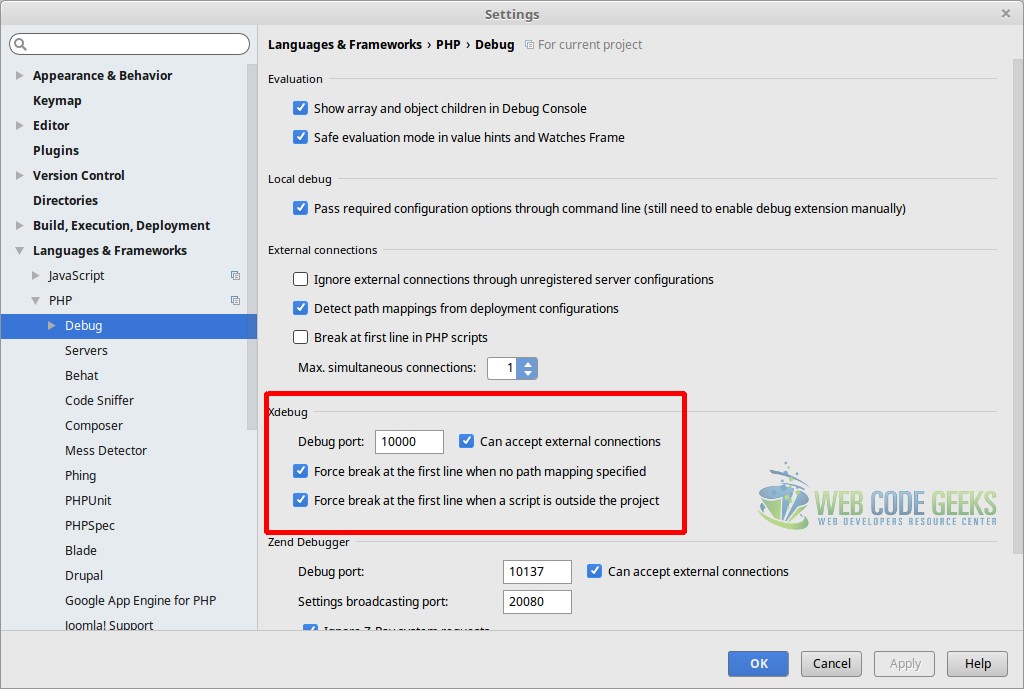
Finally, now in “File/Settings/Languages & Frameworks/PHP/Debug”, in the “Xdebug” section, we have to specify the port we set in the configuration, and mark all the options.
Once saved everything, we can start the debugging (Shift + F9) with the specified config. In the bottom part, in the “Debugger” tab, we will see the following message:
Waiting for incoming connection with ide key ‘PHPSTORM’
Meaning this, that we are ready to start debugging.
5. Debugging the PHP code
For debugging, we can create a script as simple as the following:
example.php
<?php

$var = 5;

$var++;

echo 'example.php'
And adding a breakpoint, for example, for the echo 'example.php'; statement, clicking left to it, outside the text editor. A read breakpoint will appear.
If now, we execute the script accessing it from the web server, entering the http://localhost:8080/example.php URL in the browser, we will see that some variables will appear:
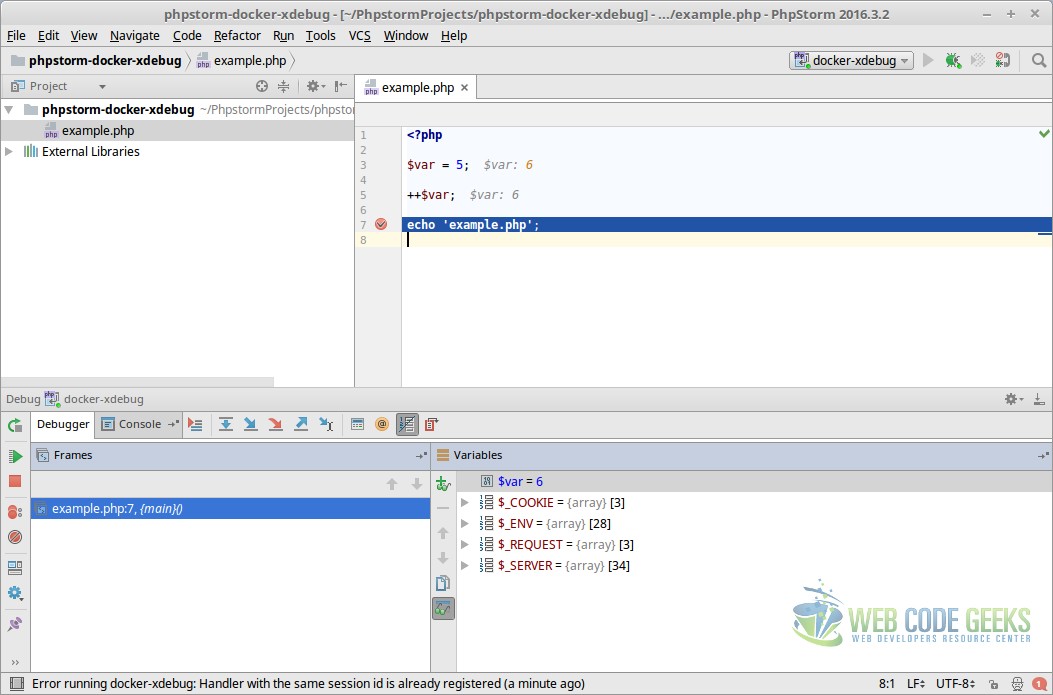
As we can see, the debugger shows both PHP built-in variables, and the variables we have declared in our script. In this case, in the current breakpoint, shows that the variable value is 6, since we have incremented it in the previous statement.
6. Summary
This tutorial has shown how to easily have a complete PHP development environment with Xdebug thanks to Docker, just defining a Dockerfile with the configuration for Xdebug and creating a container; and then configuring the PhpStorm IDE to make use of it.
Thanks, Jule, for this easy-to-follow recipe!
It worked nicely.
One thing some might consider: Incoming port 10000 may not be open but restricted by a firewall, so open it first (which I had to do).
Best regards,
Constantin