Back in my Docker hosting post, I noted that deploying and orchestrating containers live was still a missing step in the Docker workflow for many developers. A handful of complex orchestration tools entered to fill the void, with large cloud companies offering to host your setup for you. In that post, I intentionally avoided tools that sat in the middle of this process by helping you to deploy containers to cloud services, but there are plenty of them, including Docker’s own official cloud service. There is still plenty of opportunity for similar services and less than a month ago, I heard of a new option, Kontena.
Kontena is a (moderately expensive) SaaS platform that you can install on cloud providers or your own hardware. A lot of the core code is open source, but I’m unclear if you can run the platform without paying for it.
For any of you already experienced with core Docker tools like Swarm and Compose, Kontena follows similar patterns but adds features to them specific to the platform. Again, this is a common path to follow for similar existing services.
Kontena has a great quick start guide, so I will use that as a base to discuss the platform further.
Set Up the Platform
You can create your platform of nodes using a CLI tool or a web interface. The CLI tool offers a lot more options, and the web interface is better suited to monitoring. Kontena supports cloud hosting (for extra charges) with AWS EC2, Azure, DigitalOcean, Packet, and UpCloud. You can also add nodes manually to Ubuntu and Container Linux hosts or use Docker Compose to streamline the process further.
For this article (and in Kontena’s quick start), I used a Vagrant installation, which still shows up in the Kontena portal. It looks like their system images are based on CoreOS, which opens the platform to a lot of potential.
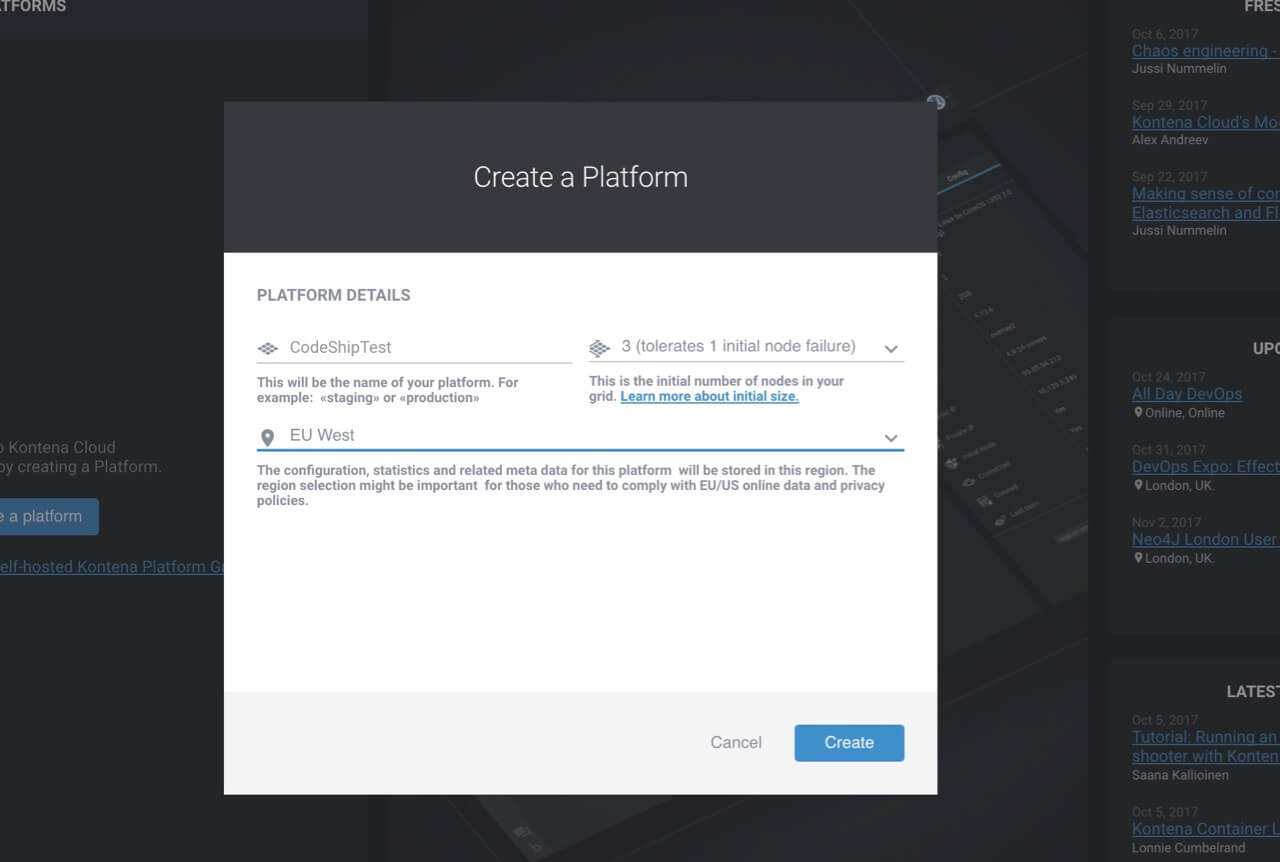
Next, create your platform and give it a name. You can use the web interface or the CLI tool.
kontena cloud platform create <PLATFORM_NAME>
The first subcommand (cloud) allows you to interact with aspects of the cloud service, such as the infrastructure, individual nodes, containers, and storage volumes.
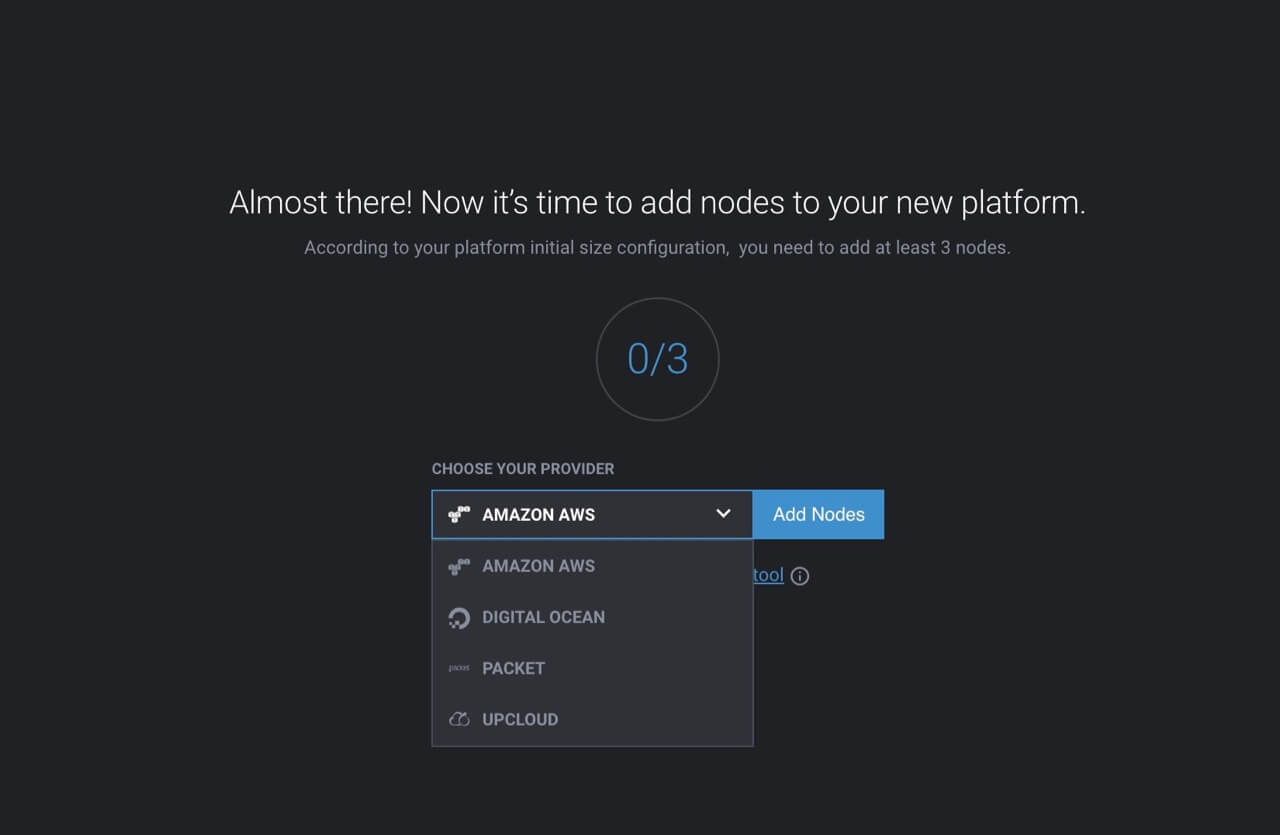
Add Nodes
With a platform created, you need to add individual nodes to it. Kontena will treat all nodes as part of the service, no matter where you host each one.
You add nodes from the CLI tool, selecting the appropriate provider. For example, with Vagrant, it’s the following:
kontena vagrant node create
And for AWS, it’s:
kontena aws node create
You can view all your current nodes with the following CLI command:
kontena node list
or under the Nodes tab of the web interface:

Create an Application Stack
Now that the infrastructure is ready, it’s time to create an application, or “stack” in Kontena terminology. You create stacks by defining a ‘stack file‘ that is like a Docker Compose file, with some extra values to match the Kontena platform.
You can see what stacks you are running with the following command:
kontena stack ls
Or details of an individual stack with:
kontena service show <STACK_NAME>/<SERVICE_NAME>
There isn’t a specific tab in the web interface for stacks, but individual tabs exist for each component of a stack; for this example, Services and Vault (for secrets management).
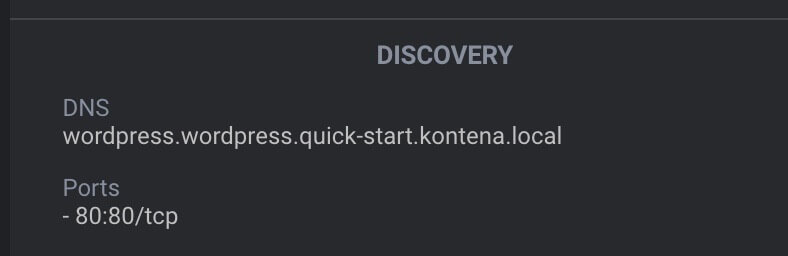
Run Your Application
Accessing your application depends slightly on where the nodes in your platform are hosted. Using the kontena service show command and clicking through to service details in the web application will show you the public IP and DNS addresses. However, if you are using Vagrant, you will need the private IP address, which you can find with:
kontena node show <PUBLIC_NODE_NAME> | grep 'private ip'
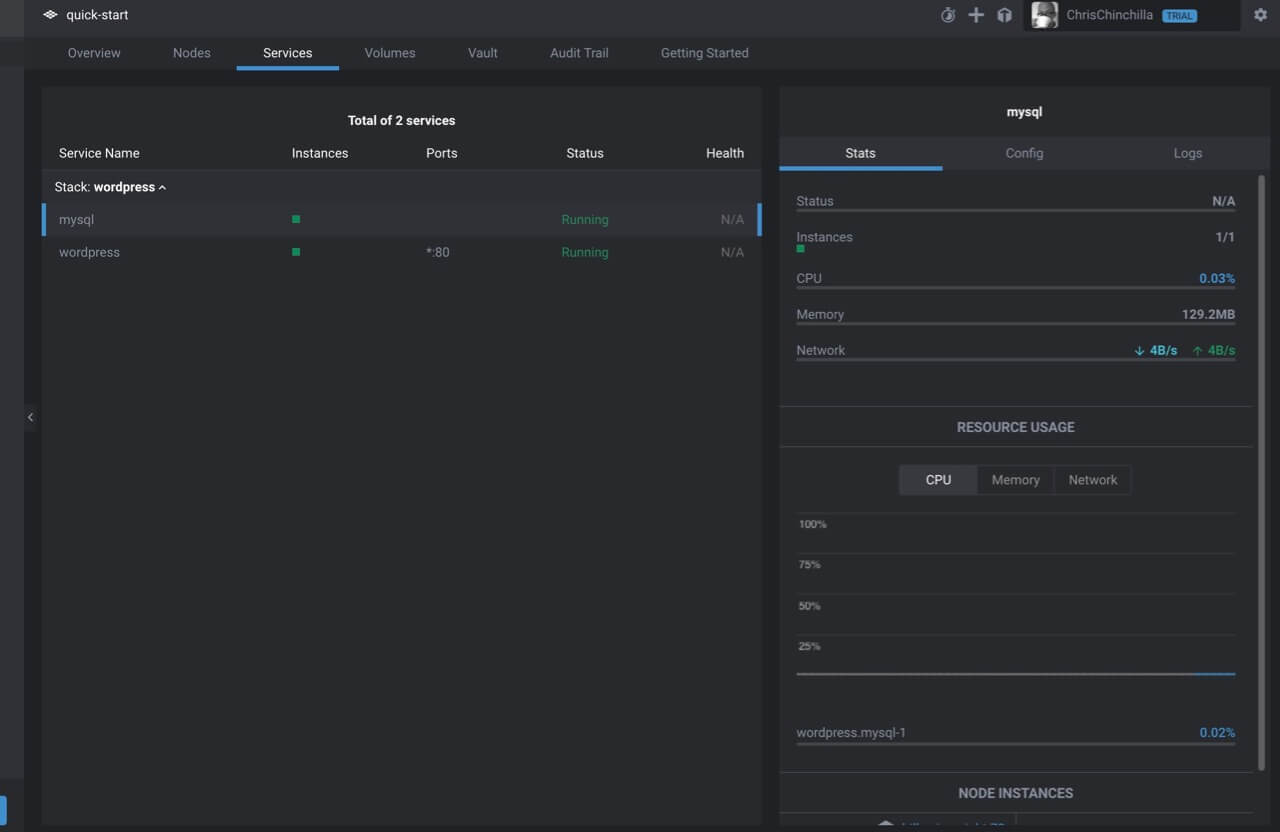
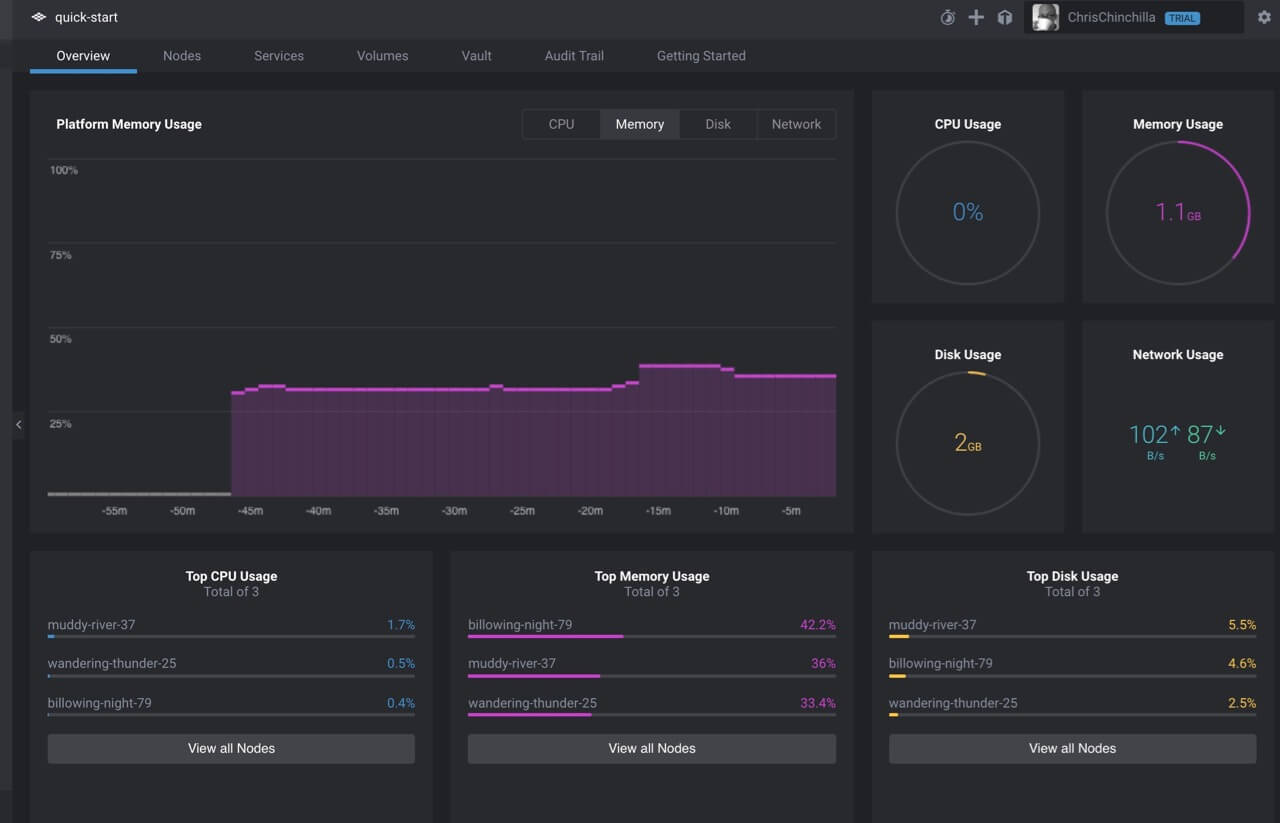
Kontena also provides an overview of resource usage and logs of all your nodes and services in the web application, as well as a briefer overview from the command line:
kontena service stats <STACK_NAME>/<SERVICE_NAME>
For more fine-grained and long-term statistics collection, Kontena allows you to connect platforms to external collection services using the StatsD protocol. You do this using the grid subcommand that is generally used for self-hosted Kontena platforms, but you can also use it to customize the SaaS platform.
kontena grid update --statsd-server <STATSD_SERVER>:8086 <GRID_NAME>
The grid typically has the same name as the platform, but if you want to check, use the following command:
kontena grid list
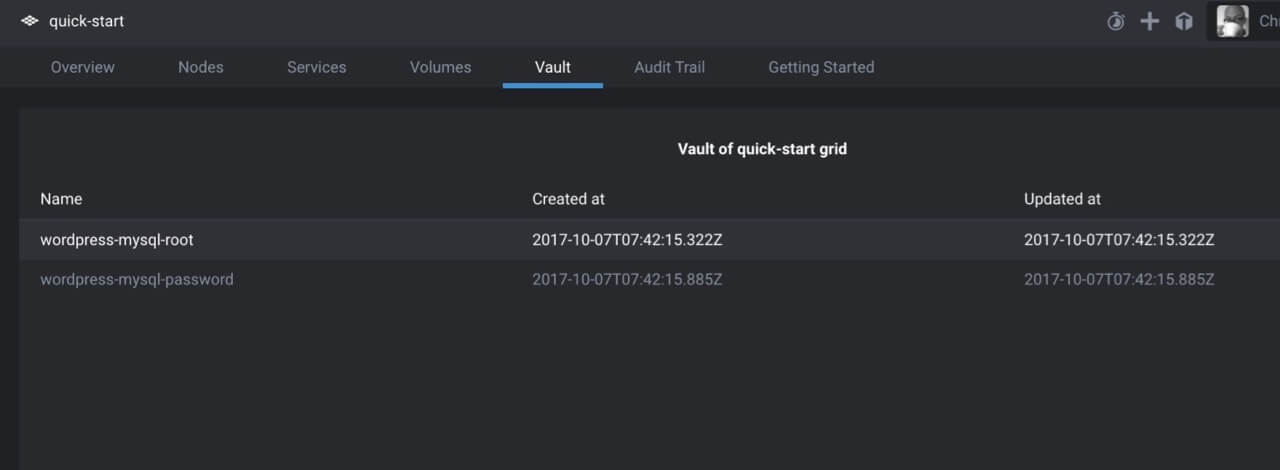
Secrets management
I briefly mentioned secrets management above. This is a growing trend in container-based infrastructures; I’ve written about Docker’s own secrets management and HashiCorp’s Vault. I’m not sure what Kontena uses, but the principles are the same.
kontena vault write <NAME> <VALUE>
kontena vault read <NAME>
Or more practically, you can share the secrets in the kontena.yml file:
services:
  wordpress:
  …
    environment:
      WORDPRESS_DB_HOST: mysql
      WORDPRESS_DB_USER: wordpress
      WORDPRESS_DB_NAME: wordpress
    secrets:
      - secret: wordpress-mysql-password
        name: WORDPRESS_DB_PASSWORD
        type: env
  mysql:
    …
    environment:
      MYSQL_DATABASE: wordpress
      MYSQL_USER: wordpress
    secrets:
      - secret: wordpress-mysql-root
        name: MYSQL_ROOT_PASSWORD
        type: env
      - secret: wordpress-mysql-password
        name: MYSQL_PASSWORD
        type: env
Kontena also adds certificate management with LetsEncrypt, allowing you to manage the entire process from the CLI tool.
Load balancing
Kontena includes support for load balancing, which you define in your kontena.yml file and then link services to it.
cs_loadbalancer:
  image: kontena/lb:latest
  ports:
    - 80:80
wordpress:
  …
  environment:
    WORDPRESS_DB_HOST: mysql
    WORDPRESS_DB_USER: wordpress
    WORDPRESS_DB_NAME: wordpress
    KONTENA_LB_INTERNAL_PORT: 80
  links:
    - cs_loadbalancer
And the load balancer will now appear in your list of active services.
Volumes
Kontena volumes work in a similar way to volumes in Docker, but add the ability to define the ‘scope’ of a mounted volume and if it’s accessible to each instance, stack, or across the whole platform. There’s a parameter for defining the driver, but I couldn’t find any details on what’s supported.
kontena volume create --driver <DRIVER> --scope <SCOPE> <VOLUME_NAME>
All You Need?
Kontena is a developer-friendly and easy-to-use platform, with a lot of compelling features to suit a lot of complex application stacks. But bearing in mind you also have to pay hosting costs, is it worth the price versus running your own Mesos or Kubernetes cluster?
As with many SaaS platforms, you offset convenience for developer time spent. I’d love to know if you think the feature list justifies the price.
| Published on Web Code Geeks with permission by Chris Ward, partner at our WCG program. See the original article here: An Overview of the Kontena Platform Opinions expressed by Web Code Geeks contributors are their own. |
The excellent saas platform is now just relevant. Was it developed by these guys ardas-it.com/saas-development ?
Smart dashboard for Kubernetes. I like this dashboard, it’s free. For Saas development, I used Mac OS. It is convenient to navigate by related clusters.
It is very convenient to monitor processes, especially for a Saas project.