Discover faster, more efficient performance monitoring with an enterprise APM product learning from your apps. Take the AppDynamics APM Guided Tour!
Since its introduction four years ago, Docker has vastly changed how modern applications and services are built. But while the benefits of microservices are well documented, the bad habits aren’t.
Case in point: As people began porting more of their monolithic applications to containers, Dockerfiles ended up becoming bloated, defeating the original purpose of containers. Any package or service you thought you needed was installed on the image. This led to minor changes in source or server, forcing you to rebuild the image. People would package multiple processes into a single Dockerfile. And obviously, as the images got bigger, things became much less efficient because you would spend all of your time waiting on a rebuild to check a simple change in source code.
The quick fix was to layer your applications. Maybe you had a base image, a language-specific image, a server image, and then your source code. While your images became more contained, any change to your bottom-level images would require an entire rebuild of the image set. Although your Dockerfiles became less bloated, you still suffered from the same upgrade issues. With the industry becoming more and more agile, this practice didn’t feel aligned.
The purpose of this blog is to show how we migrated an application to Docker—highlighting the Docker best practices we implemented—and how we achieved our end goal of monitoring the app in AppDynamics. (Source code located here)
Getting Started
With these best (and worst) practices in mind, we began by taking a multi-service Java application and putting it into Docker Compose. We wanted to build out the containers with the Principle of Least Privilege: each system component or process should have the least authority needed to complete its tasks.
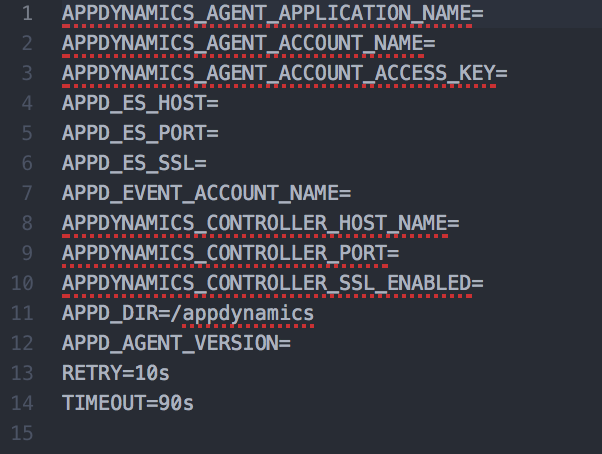
The containers needed to be ephemeral too, always shutting down when a SIGTERM is received. Since there were going to be environment variables reused across multiple services, we created a docker-compose.env file (image below) that could be leveraged across every service.
Instead of downloading and installing Java or Tomcat in the Dockerfile, we decided to pull the images directly from the official Tomcat in the Docker Store. This would allow us to know which version we were on without having to install either Java or Tomcat. Upgrading versions of Java or Tomcat would be easy, and would leave the work to Tomcat instead of on our end.
We knew we were going to have a number of services dependent on each other and linking through Compose, and that a massive bash script could cause problems. Enter Dockerize, a utility that simplifies running applications in Docker containers. Its primary role is to wait for other services to be available using TCP, HTTP(S) and Unix before starting the main process.
Some backstory: When using tools like Docker Compose, it’s common to depend on services in other linked containers. But oftentimes relying on links is not enough; while the container itself may have started, the service(s) within it may not be ready, resulting in shell script hacks to work around race conditions.
Dockerize gives you the ability to wait for services on a specified protocol (file, TCP, TCP4, TCP6, HTTP, HTTPS and Unix) before starting your application. You can use the -timeout # argument (default: 10 seconds) to specify how long to wait for the services to become available. If the timeout is reached and the service is still not available, the process exits with status code 1.
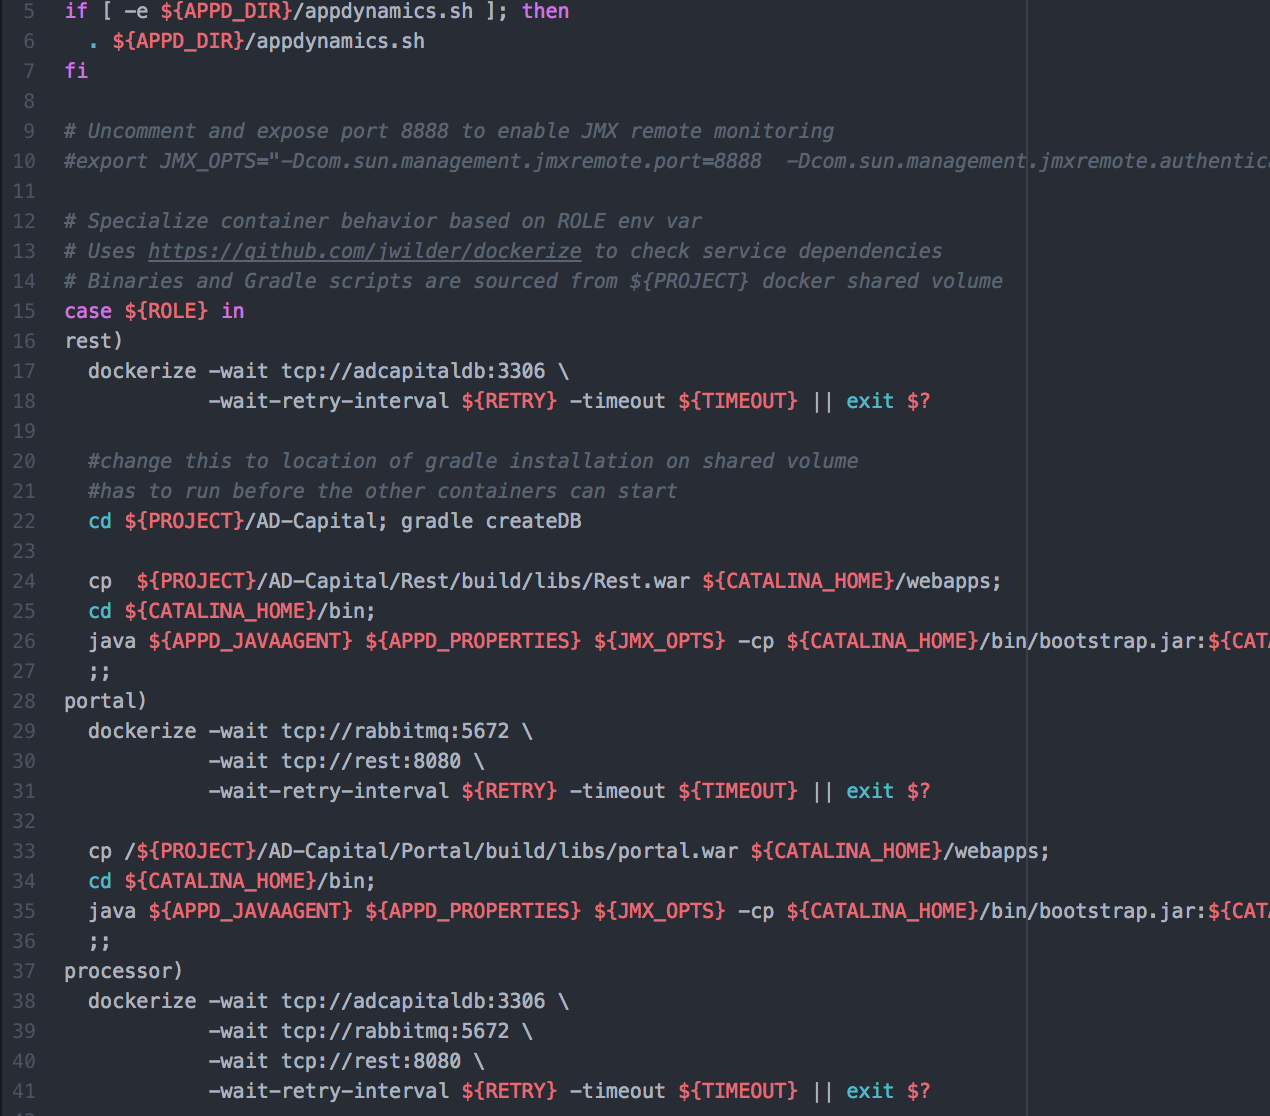
We then separated the source code from the agent monitoring. (The project uses a Docker volume to store the agent binaries and log/config files.) Now that we had a single image pulled from Tomcat, we could place our source code in the single Dockerfile and replicate it anywhere. Using prebuilt war files, we could download source from a different time, and place it in the Tomcat webapps subdirectory.
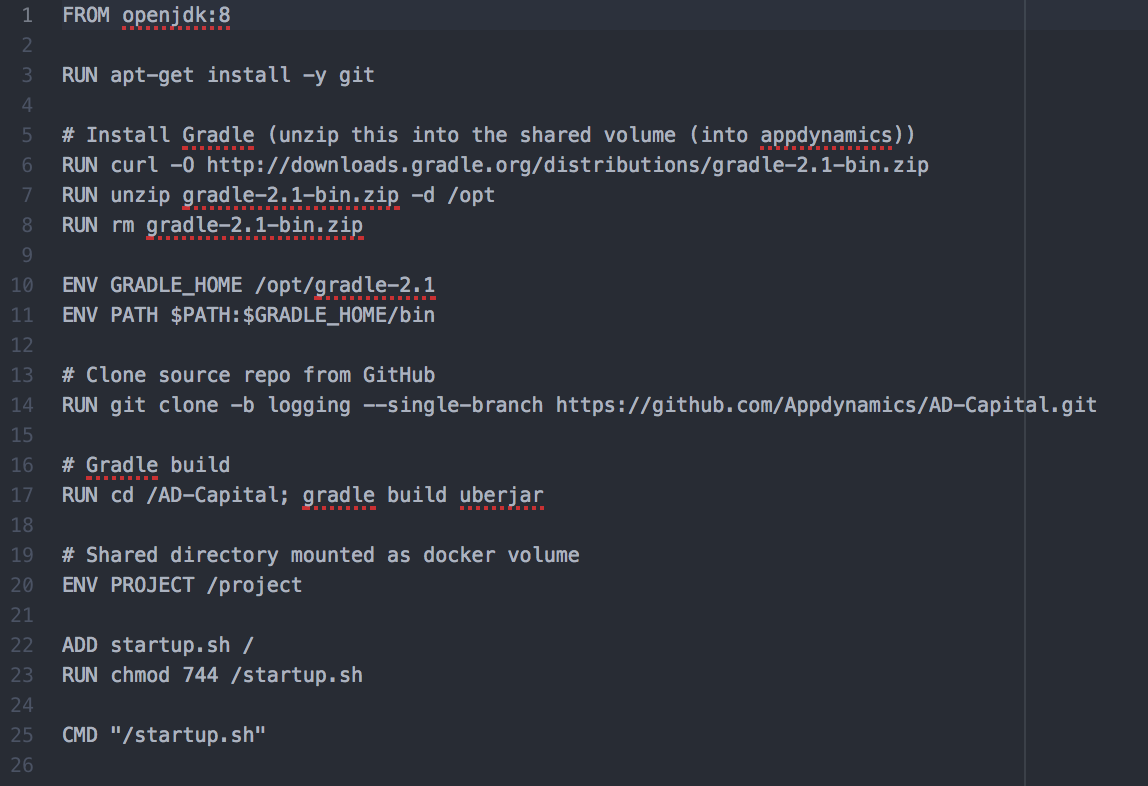
We now had a Dockerfile containing everything needed for our servers, and a Dockerfile for the source code, allowing you to run it with or without monitoring enabled. The next step was to split out the AppDynamics Application and Machine Agent.
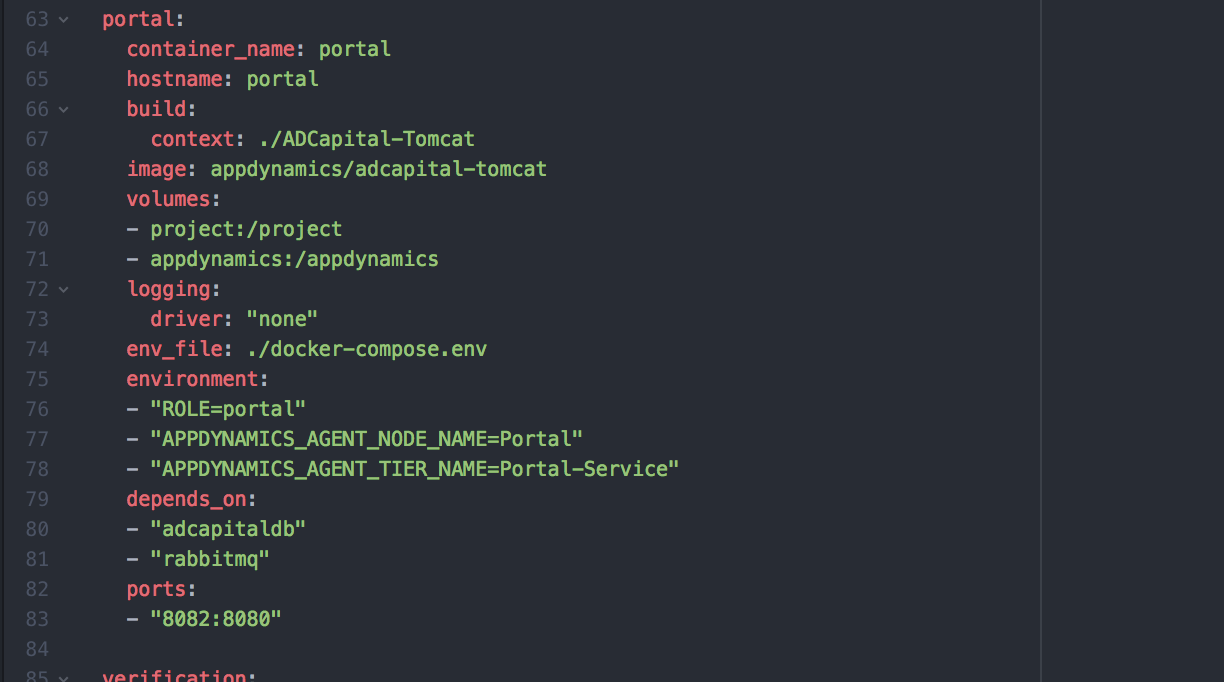
We knew we wanted to instrument with our agents, but we didn’t want a configuration file with duplicate information for every container. So we created a docker-compose.env. Since our agents require minimal configuration—and the only difference between “tiers” and “nodes” are their names—we knew we could pass these env variables across the agents without using multiple configs. In our compose file, we could then specify the tier and node name for the individual services.
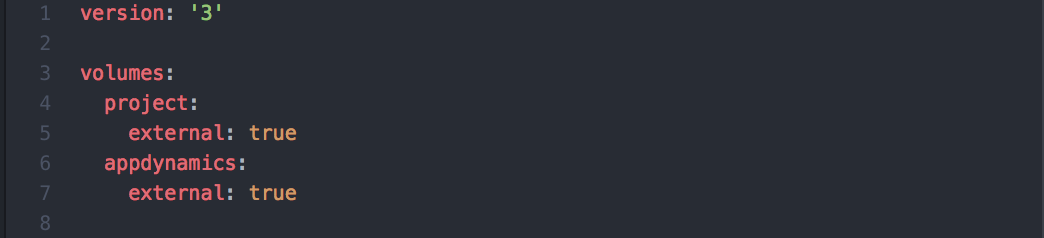
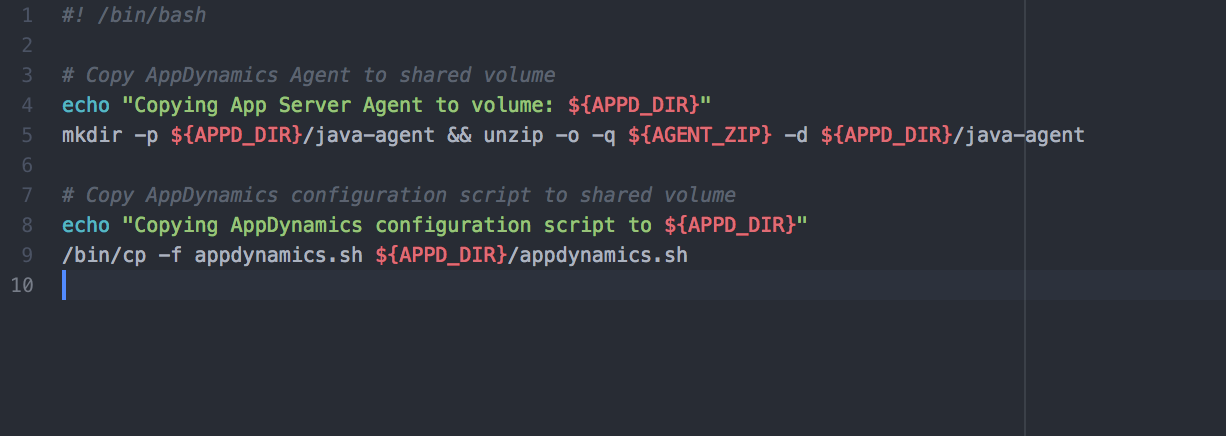
For the purpose of this blog, we downloaded the agent and passed in the filename and SHA-256 checksum via shell scripts in the ADCapital-Appdynamics/docker-compose.yml file. We were able to pass in the application agent and configuration script to run appdynamics to the shared volume, which would allow the individual projects to use it on startup (see image below).
Now that we had enabled application monitoring for our apps, we wanted to install the machine agent to enable analytics. We followed the same instrumentation process, downloading the agent and verifying the filename and checksums. The machine agent is a standalone process, so our configuration script was a little different, but took advantage of the docker-compose.env variable name to set the right parameters for the machine agent (ADCapital-Monitor/start-appdynamics).
The payoff? We now have an image responsible for the server, one responsible for the load, and another responsible for the application. In addition, another image monitors the application, and a final image monitors the application’s logs and analytics. Updating an individual component will not require an entire rebuild of the application. We’re using Docker as it was intended: each container has one responsibility. Lastly, by using volumes to share data across services, we can easily check agent and application Logs. This makes it much easier to gain visibility into the entire landscape of our software.
If you would like to see the source code used for this blog, it is located here with instructions on how to build and setup. In the next blog, we will show you how to migrate from host agents, using Docker images from the Docker store.
Discover faster, more efficient performance monitoring with an enterprise APM product learning from your apps. Take the AppDynamics APM Guided Tour!