Want to know How to Build (and Scale) with Microservices? Download the Whitepaper from AppDynamics: Grab it now!
As we review the history of enterprise applications we have seen several trends emerge over the years. In the mid-late 90s we built applications to be large and monolithic because they were destined to be published to very large and vertically scalable machines, such as mainframes. Even as applications migrated from mainframes to more flexible languages such as Java and large servers,, we still wanted to conserve memory so it was in our best interest to deploy our applications as large enterprise archives (EAR files).
As we discovered virtualization and were able to run our application across several virtual machines, we broke our applications into individually deployable services. These services, popularized by service-oriented architectures, had distinct roles, but they were still large deployments because we had limited capacity in terms of the number of virtual machines that we wanted to run; virtual machines were less expensive than physical servers, but they still had a relatively high cost associated with them. Then the cloud entered and we were able to elastically scale up and down virtual machines to meet our load, so we broke our applications down even further. Cloud-based virtual machines were still relatively slow to startup, albeit measured in seconds or up to a couple minutes, which made us cognizant of the granularity in which we deployed our services.
The last couple years have introduced containerization, leveraging technologies like Docker, which has encouraged us to break our applications into microservices. A microservice is a very small service with a well defined and open interface that does one thing and does it well. This paradigm shift has afforded us many benefits, the primary of which are:
– Independent deployments
– Independent scalability
– Isolated and reusable functionality
From an application management perspective, microservices allow us to deploy far more often and in isolation from the other components that comprise our application. For example, if we build a user profile service, as long as we maintain our interface agreements, we are free to deploy it without unintentionally breaking other parts of our application, such as our web site or even our authentication service, which may directly depend on our user profile service. In other words, the team that builds the user profile service can deploy separately and on a different release schedule from our application’s other components.
Furthermore, because each microservice is deployed separately from other application components, it means that we can scale our microservices independently. If our authentication service receives significantly more load than our user profile service then we can deploy more authentication containers. Microservices encourages us to deploy often, which helps us achieve the long sought agility and leanness we have been aiming for. Microservice architectures can yield hundreds, or even thousands, of microservices, which introduces new challenges in managing both the deployment as well as the performance of those microservices.
This paper reviews six challenges in managing the performance of microservices:
– Managing individual microservices in a holistic application
– Collectively managing the multitude of microservices across an application
– Managing the performance of holistic business transactions that depend on our microservices
– Managing the performance of our microservices in a new elastic world
– Managing microservices running in a hybrid cloud environment that spans both a public as well as a private cloud
– Managing the containers, such as Docker, that host our microservices
Managing individual microservices
A business transaction, as we use the term, is a significant interaction with an application, such as logging in, adding an item to a shopping cart, or checking out. In a microservices architecture, a business transaction may interact with dozens of microservices and an individual microservice may be called by dozens of different business transactions. Our most important unit of measure to assess the success of our business outcomes, which are dependent on the customer experience of the application, is to measure the performance of business transactions, but because a business transaction calls dozens of microservices, a performance problem in an individual microservice may not surface at the business transaction level.
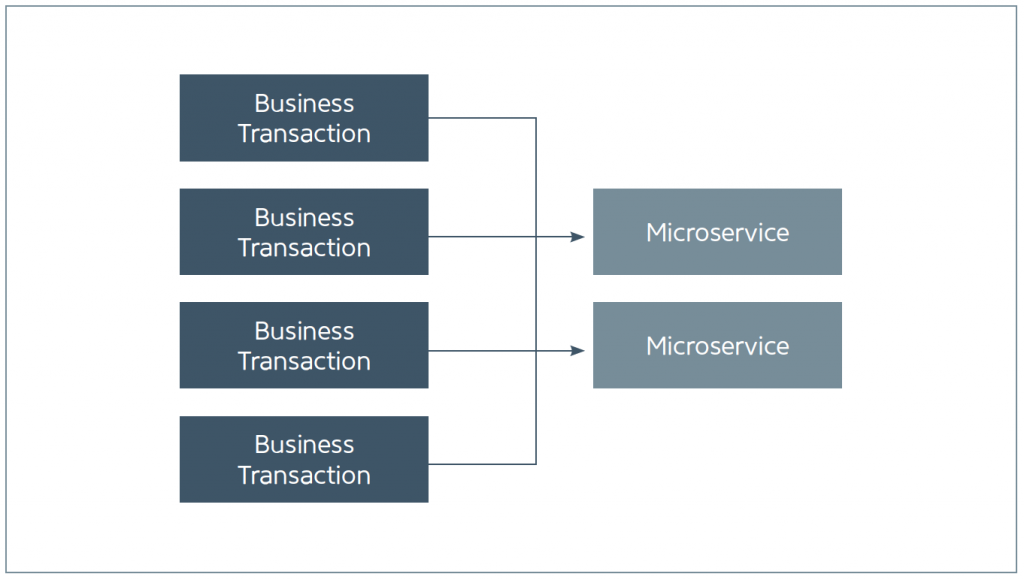
Furthemore, we are encouraged to build our applications with a high degree of resiliency, so if a microservice is not available or times out then our business transaction may return normally, but missing some information. Figure 1 shows four business transactions each calling two different microservices.
The best strategy, therefore, is to measure both the performance of business transactions holistically as well as the individual microservices. As a microservice owner, you not only want to identify all of the business transactions that invoke your microservice, but, you will want to measure the performance of your microservice irrespective of the distributed application environment, capturing detailed snapshots of performance issues that involve your microservice. Figure 2 shows an example of such an aggregated view.
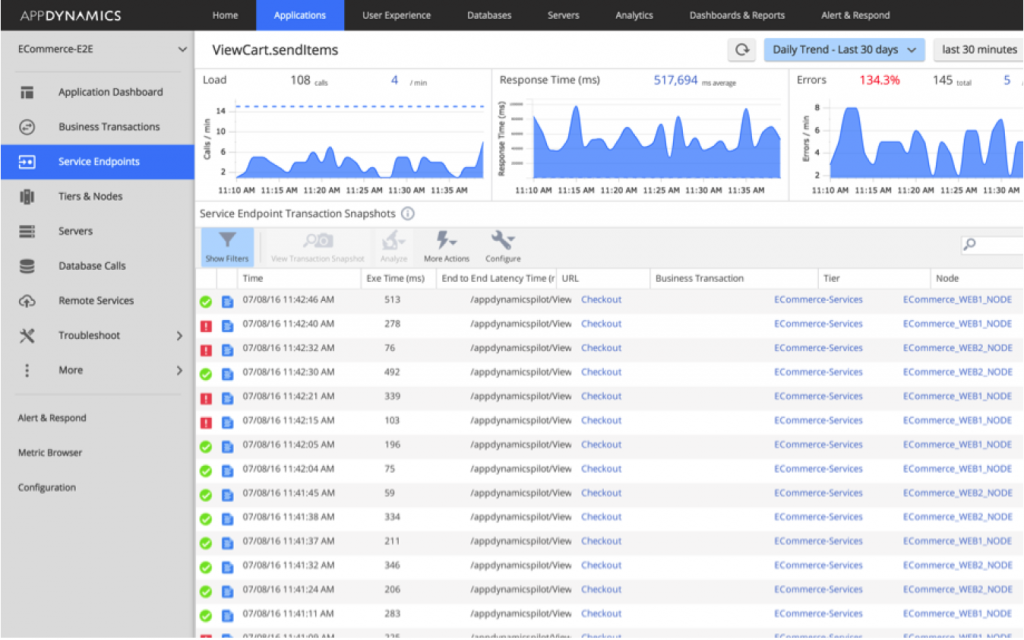
This dashboard shows key performance indicators (KPIs), such as calls per minute, average response time, and errors per minute of an individual microservice and provides access to snapshots that were captured when business transactions that included your microservice were performing abnormally. In order to effectively manage the performance of your microservice, you need to isolate your microservice and analyze its behavior across all business transactions that invoke it.
Managing a multitude of microservices
As mentioned above, a microservices architecture necessarily breaks an application down into small distinct pieces and assembles its business functionality by stitching together dozens of those pieces. Finely grained services provide the many benefits discussed above, but this type of architecture does mean that your application might contain hundreds or even thousands of microservices. The sheer scale and magnitude of managing this number of microservices negates the practicality of manually instrumenting them for performance monitoring and setting realistic service level agreement (SLA) thresholds. Consider how overwhelming it would be to manually register each service with a performance repository and define realistic performance criteria – it can be done, but at this scale it would consume a significant amount of time and effort and, when defining the performance expectations for thousands of microservices, you’re sure to get at least a few wrong!
The solution, therefore, is to put in place a monitoring technology that automatically discovers all of the microservices in your application and constructs a baseline of the performance of each microservice. A baseline identifies the “normal” behavior for your microservice and should be configured based on your user behavior. For example, if your service gets more load on a Friday morning than it does on a Sunday afternoon then you would want to compare the behavior of your microservice on a Friday morning against its normal behavior on historic Friday mornings. After making this comparison, if the service is behaving abnormally then you can raise an alert, capture a method-level snapshot illustrating the problem, and start troubleshooting. Even better, you can configure a rule that starts more instances of your microservice to quickly remediate the problem.
The point is that the sheer scale of the number of deployment units in a microservices architecture necessitates an automated solution.
Measuring the performance holistic business transactions
In the pre-microservices era, a single business transaction was composed of a handful of service calls, but today that same business transaction may call dozens of microservices. As a result, understanding the performance of your application is complicated and can be a daunting undertaking. The most important measure of the performance of your application is the performance and availability of your business transactions. Business transaction performance answers the key question: are users able to accomplish their business objectives in an acceptable amount of time? If the answer is “yes” then your application is successful and your company is making money. If the answer is “no” then your application is under duress and you may be losing money.
The strategy for measuring business transaction performance is to (1) properly identify “entry points” that start a business transaction, (2) capture the response time for each “tier” in the business transaction, where a tier is defined by a call from one service to another, (3) construct a baseline of the performance of each tier as well as the holistic business transaction, and (4) compare the current response time of the business transaction, and its tiers, to the appropriate baseline. Baselines will vary depending on your user and application behavior. Common baselines include:
– Hour of the day: if your application receives more load at 8am than it does at 2am then the current response time should be compared against the same historic hour of the day
– Day of the week: if your application experiences different load on different days of the week then the current response time should be compared against the response time for that same hour of the day, but on that same day of the week (compare 9am on Monday to history 9am on Mondays)
– Day of the month: if your application experiences different load on different days of the month, such as a banking application that might receive more load when people get paid on the 15th or 30th of the month, then you would want to compare the current response time to the historic response for that hour of day on that day of the month
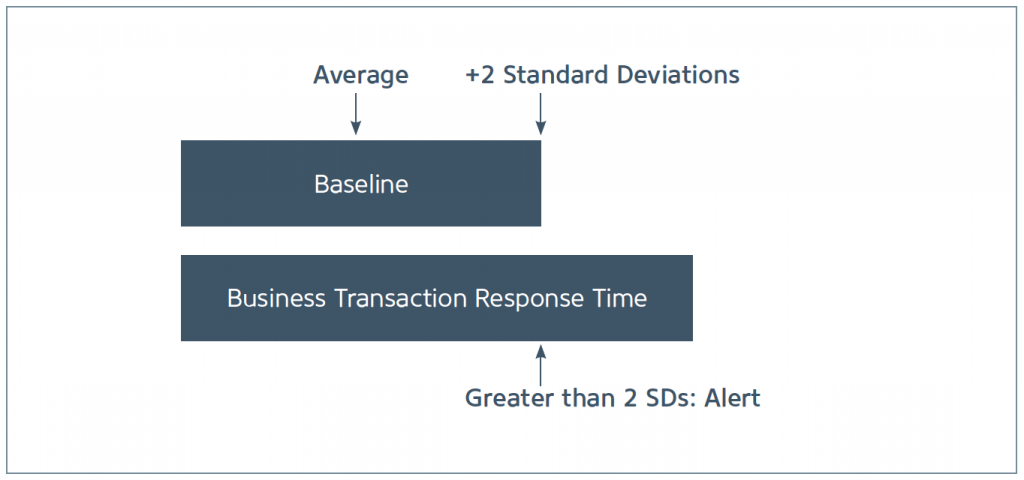
Once the proper baseline has been identified for your business transaction then the current response time can be evaluated against the baseline to determine if performance is normal. Figure 3 shows an example that compares the current response time of a business transaction against its baseline and alerts if the response time is greater than two standard deviations from its average.
Baselines should be created against business transactions and against the tiers that comprise those business transactions. From a microservices perspective, each microservice call will represent a tier in the business transaction and will have its own baseline, in the context of that business transaction. This strategy allows you to understand whether or not your users are able to accomplish their business objectives and whether or not your microservice, in the context of a specific business transaction, is behaving normally.
Want to know How to Build (and Scale) with Microservices? Download the Whitepaper from AppDynamics: Grab it now!
Managing the performance of an elastic environment
Probably the most powerful feature of public clouds, such as Amazon Web Services (AWS), in general, and containerization specifically, is the ability to elastically scale. As load increases, the number of containers (instances running your microservice) can increase and as load decreases, the number of containers can likewise decrease. Furthermore, this elasticity can be driven by performance rules without requiring any human intervention. Containerization makes this process more efficient than traditional virtualization because containers can start in a few seconds, as compared to virtual machines that might take a couple minutes to fully start. This means that containerization can provide additional elastic capacity right when it’s needed. As a result of this dynamic elasticity, some containers may run all day whereas other might only run for a few minutes.
This makes performance monitoring challenging because as containers, or nodes, come and go, it is difficult to track the nodes in the context of their associated business transactions. As a result, your monitoring solution may think you have thousands of nodes, most of which are unavailable because those containers have stopped and restarted several times! The solution, therefore, is to track and retain the historical behavior of the transient nodes on which your containers run. When a container is deactivated and subsequently restarted then it can pick up from where it left off, without losing its historical data in the process. This reduces the number of meaningless nodes in your monitoring solution and provides you with continued historical performance for a given container.
Microservices running in hybrid cloud environment
Deploying microservices to a public cloud-based environment is a powerful solution that many companies are trying to achieve, but as with any new technology, adoption may be performed slowly and in stages. Business and compliance rules may require that certain components remain in a company’s own data center, such as those that manage PCI and PII information
Most large companies have already invested heavily in infrastructure so it does not make sense to immediately move to a public cloud and sell off that existing infrastructure. Instead of fully embracing a public cloud, many companies are setting up their own private clouds in their own data center, using technologies like OpenStack or MesoSphere, and then splitting their deployments across their own private cloud as well as a public cloud.
A deployment that encompasses both a private cloud and a public cloud is referred to as a hybrid cloud environment, which presents its own set of challenges:
– The hardware in the private cloud is different from the hardware in a public cloud so one deployment of the same container might perform differently in a private cloud and in a public cloud.
– Many performance management solutions restrict themselves to a single data center, which means that some of your performance data might be in one location and some may be in another location. When a performance problem does occur it can be challenging to troubleshoot across different environments because you do not know which environment is hosting the data that you need.
– Additionally, many business transactions will pass back-and-forth between the private and public cloud and, in order to fully assess the performance of your application, you need to construct a holistic view of the application in its entirety. This type of hybrid environment is shown in figure 4.
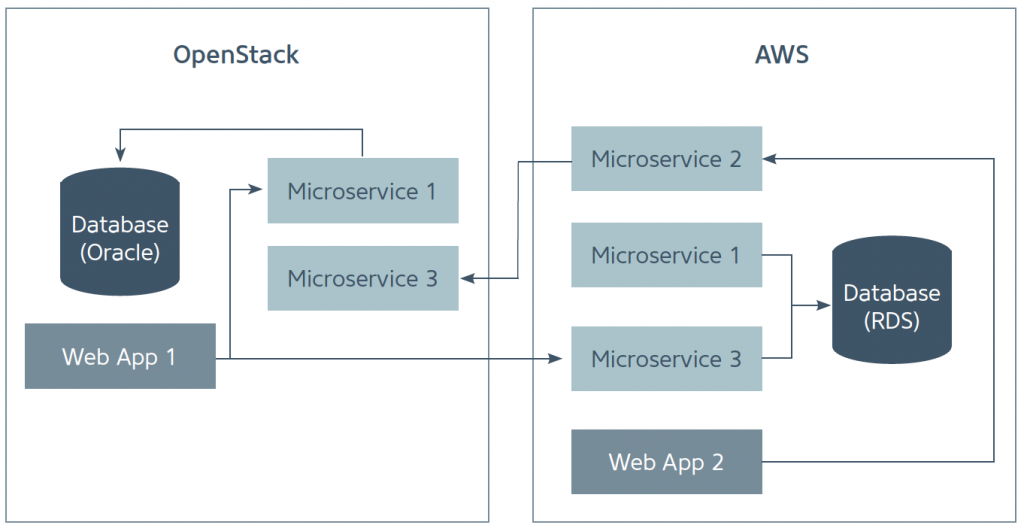
This example illustrates how a single business transaction, presumably starting with a web application call or a service call from a mobile application, can easily span both a private and a public cloud. From a deployment perspective, the best strategy to manage a hybrid cloud is to adopt a single containerization technology, such as Docker, so that a microservice can just as easily be deployed to the private or public cloud, using tools that abstract the underlying environment. From a monitoring and performance management perspective, it is important to do the following:
– Monitor performance at the business transaction level so that you have a holistic view of your application behavior
– Trace business transactions as calls traverse across data centers (private as well as public clouds)
– Monitor the performance of the containers hosting your microservices
– Capture information about the node upon which your microservices are running so that you are able to account for differences in the underlying hardware
All of this is to say that that you need to monitor your applications at the business transaction level, including components running across your hybrid cloud environment. You need to be able to isolate the performance of individual microservices in order to detect systemic problems in those service. And you need to understand the differences between the underlying hardware that runs in your private cloud and the hardware that runs in your public cloud.
Microservices and Docker
Microservices and containerization go hand-in-hand. You do not want to dedicate a full virtual machine for each microservice, but rather you want to install your containerization technology across a cluster of virtual machines and let that containerization technology distribute containers as it deems appropriate. The most popular containerization technology, as of this writing, is Docker, so this section focuses on Docker specifically. The important things to do when monitoring a microservice running in a Docker container are to:
1. Monitor the performance of your microservice itself
2. Monitor the performance of the Docker container running your microservice and correlate the container’s behavior with the performance of your microservice
3. Monitor the health of the Docker cluster
We have already reviewed monitoring microservice performance, both holistically as part of a business transaction and individually as an isolated end-point. Figure 5 shows the type of information that we want to collect about Docker itself.
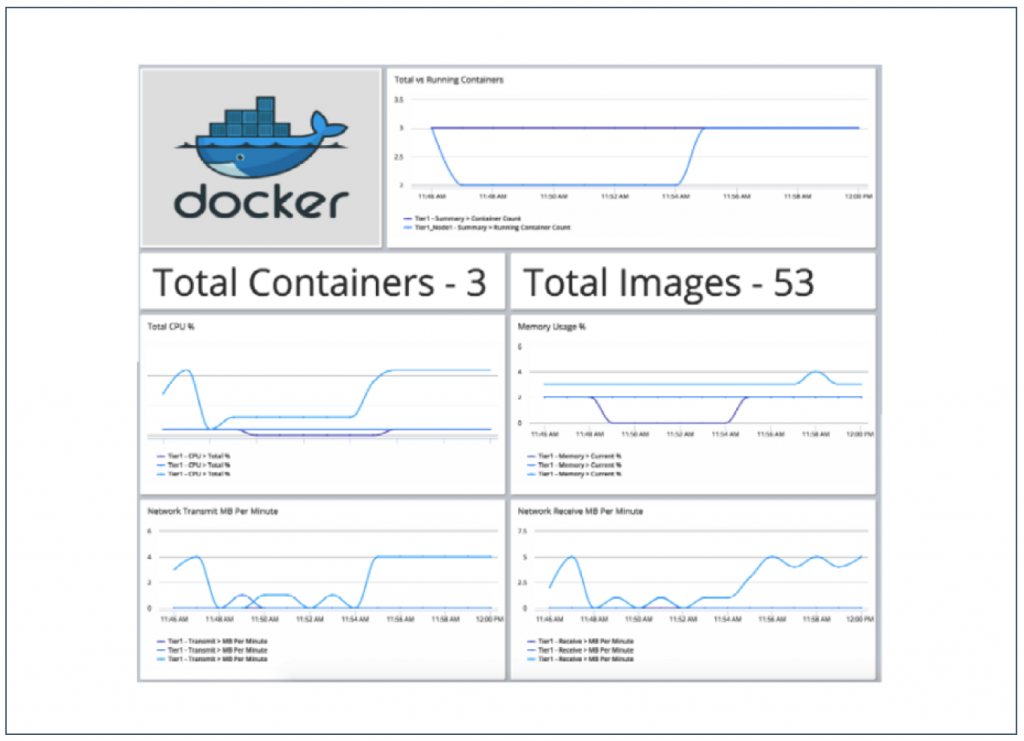
Figure 5 shows that the Docker environment contains three running containers and a total of 53 different available images (an image is the binary “template” from which we can run containers). The top chart shows that the environment is configured to run three containers (the container count) and we can see historically how many containers have been running over time. The bottom four charts show aggregate performance metrics about the running containers:
– Total CPU usage
– Memory usage
– Network Transmit megabytes per minute
– Network Receive megabytes per minute
It is important to be able to capture this type of information so that you know when to scale your environment up and down. For example, if we are running 5 of a maximum of 10 containers and the average CPU utilization of those 5 containers is above 80% then we would want to start more containers to handle the load.
Want to know How to Build (and Scale) with Microservices? Download the Whitepaper from AppDynamics: Grab it now!