The aim of this article is to give a full explanation and showcase of the Chrome Developer Tools. Dev Tools are a set of web authoring and debugging tools built into Google Chrome. The DevTools provide web developers deep access into the internals of the browser and their web application. Use the DevTools to efficiently track down layout issues, set JavaScript breakpoints, and get insights for code optimization.
DevTools can sharpen your dev process, help you discover the tools that can optimize your workflow and make life easier. Google’s nightly updated version of Chrome, the Chrome Canary, includes the latest and most powerful dev tools as an early release. From finding DOM elements to device mode view let’s explore the panels.
Table Of Contents
1. Elements
Use the Elements panel to iterate on the layout and design of your site by freely manipulating the DOM and CSS.
1.1 Inspect and Tweak Your Pages
1.1.1 Live Edit a DOM Node
To live-edit a DOM node, simply double-click a selected element and make changes:
The DOM tree view shows the current state of the tree; it may not match the HTML that was originally loaded for different reasons. For example, you can modify the DOM tree using JavaScript; the browser engine can try to correct invalid author markup and produce an unexpected DOM.
1.1.2 Live Edit a Style
Live-edit style property names and values in the Styles pane. All styles are editable, except the ones that are greyed out (as is the case with user agent stylesheets).
To edit a name or value, click on it, make your changes, and press Tab or Enter to save the change.
1.1.3 Examine and edit box model parameters
Examine and edit the current element’s box model parameters using the Computed pane. All values in the box model are editable, just click on them.
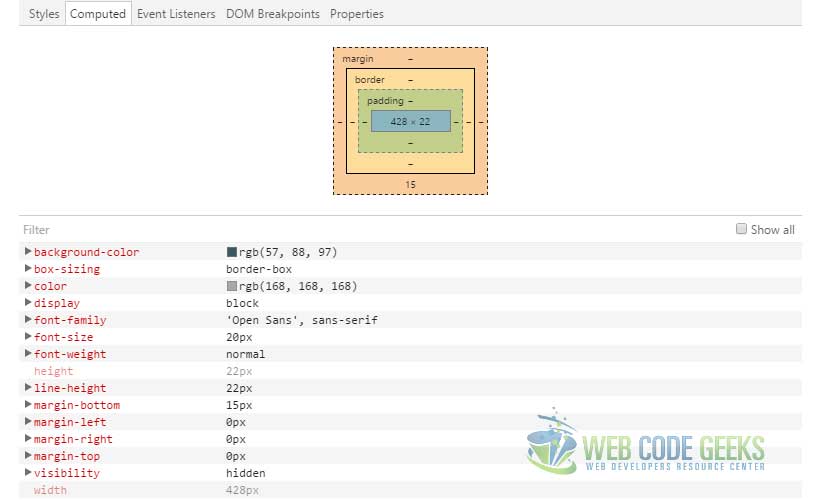
The concentric rectangles contain the top, bottom, left, right values for the current element’s padding, border, and margin properties.
1.1.4 Undo Changes
If you haven’t set up persistent authoring, any time you reload the page, all live-edits are lost.
Assuming you’ve set up persistent authoring, to undo changes:
- Use
Ctrl+Z(Windows) orCmd+Z(Mac) to quickly undo minor changes to the DOM or styles via the Elements panel. - To undo all local modifications made to a file, open the Sources panel and select revert next to the filename.
1.2 Edit Styles
You can add or edit styles within the Styles pane in the Elements panel in the following ways:
- Edit an existing property name or value.
- Add a new property declaration.
- Add a new CSS rule.
1.2.1 Inspect styles applied to an element
The Styles pane shows the CSS rules that apply to the selected element, from highest priority to lowest. In more detail, here is the meaning to different sections or signs in your style pane.
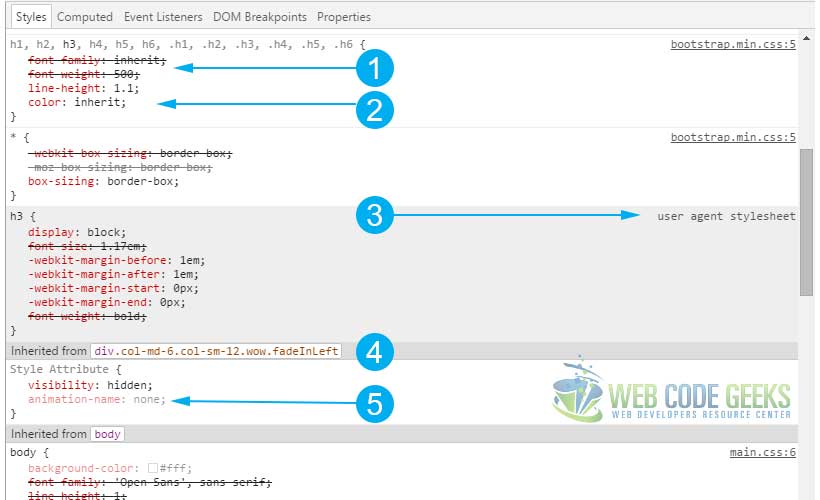
- Rules that have been overridden by cascading rules are shown with strikethrough text.
- Styles associated with a selector that matches the element.
- User agent stylesheets are clearly labelled, and are often overridden by the CSS on your web page.
- Inherited styles are displayed as a group under the “Inherited from ” header. Click the DOM node in the header to navigate to its position in the DOM tree view.
- Grey colored entries are rules that are not defined but instead computed at runtime.
1.2.2 Edit an existing property name or value
Click on a CSS property name or property value to edit; press Tab or Enter to change the name or value. When editing a numeric CSS property value, increment and decrement numeric CSS property values using the following shortcuts:
- Press
UporDownto increment or decrement the value by 1 (or by .1 if the current value is between -1 and 1). - Press
Alt+UporAlt+Downto increment or decrement the value by 0.1. - Press
Shift+Up/Down orPageUp/PageDownto increment or decrement the value by 10. - Press
Shift+PageUp/PageDownto increment or decrement the value by 100.
1.3 Edit the DOM
The DOM tree view in the Chrome DevTools Elements panel displays the DOM structure of the current web page. Live-edit the content and structure of your page through DOM updates.
1.3.1 Inspect an element
Use the Elements panel to inspect all elements in your page in one DOM tree. Select any element and inspect the styles applied to it.
1.3.2 Navigate the DOM
- Click once to highlight a node.
- To expand a node, double-click anywhere on it or click on the arrow next to it.
- To collapse a node, click on the arrow next to it.
2. Console
The Chrome DevTools Console panel is your focal point for direct interaction with a page in real time.
2.1 Using the Console
The Console lets you use standard JavaScript statements and Console-specific commands while a page is live in the browser to help you debug the page. View diagnostic messages, display both raw and structured data, control and filter output, examine and modify page elements, measure execution time, and more.
2.2 Interact from Command Line
The console is a full-fledged terminal you can use to interact with your page during development.
Using the console’s commands, you can select DOM elements, profile the CPU, monitor events, and more.
3. Sources
3.1 Debugging with Breakpoints
Chrome DevTools includes powerful breakpoint features that help you find and fix logic errors in your JavaScript code. Use different breakpoint types to control exactly what conditions can trigger a pause in script execution.
As you develop your web page, you will want to locate and correct bugs in your JavaScript. But in an executing script, the erroneous code will almost certainly be processed before you can identify it.
Pause running JavaScript at various points so you can determine its progress or examine its variable values. Chrome DevTools breakpoints let you pause your code without having to use brute-force statements such as alert("ok so far") or alert("x = " + x).
3.2 Set Up Persistence with DevTools Workspaces
Set up persistent authoring in Chrome DevTools so you can both see your changes immediatedly and save those changes to disk.
Chrome DevTools lets you change elements and styles on a web page and see your changes immediately. By default, refresh the browser and the changes go away unless you’ve manually copied and pasted them to an external editor.
Workspaces lets you persist those changes to disk without having to leave Chrome DevTools. Map resources served from a local web server to files on a disk and view changes made to those files as if they were being served.
3.2.1 Add local source files to workspace
To make a local folder’s source files editable in the Sources panel:
- Right-click in the left-side panel.
- Select Add Folder to Workspace.
- Choose location of local folder that you want to map.
- Click Allow to give Chrome access to the folder.
3.2.2 Local file management
In addition to editing existing files, you can also add and delete files in the local mapped directory you’re using for Workspaces.
Add File
To add a file:
- Right-click a folder in the left Sources pane.
- Select New File.
- Type a name for the new file including its extension (e.g., newscripts.js) and press Enter; the file is added to the local folder.
Delete a File
To delete a file:
- Right-click on the file in the left Sources pane.
- Choose Delete and click Yes to confirm.
Back up a File
Before making substantial changes to a file, it’s useful to duplicate the original for back-up purposes.
To duplicate a file:
Right-click on the file in the left Sources pane.
Choose Make a Copy….
Type a name for the file including its extension (e.g., mystyles-org.css) and press Enter.
Refresh
When you create or delete files directly in Workspaces, the Sources directory automatically refreshes to show the file changes. To force a refresh at any time, right-click a folder and choose Refresh.
This is also useful if you change files that are concurrently open in an external editor and want the changes to show up in DevTools. Usually DevTools catches such changes automatically, but if you want to be certain, just refresh the folder as described above.
Search for files or text
To search for a loaded file in DevTools, press Ctrl + O or Cmd + O (Mac) to open a search dialog. You can still do this in Workspaces, but the search is expanded to both the remote loaded files and the local files in your Workspace folder.
To search for a string across files:
Open the search window: click the Show Drawer button Show drawer and then click the Search; or press Ctrl + Shift + F or Cmd + Opt + F (Mac).
Type a string into the search field and press Enter.
If the string is a regular expression or needs to be case-insensitive, click the appropriate box.
4. Network
4.1 Network Panel Basics
The Network panel records information about each network operation in your application, including detailed timing data, HTTP request and response headers, cookies, WebSocket data, and more.
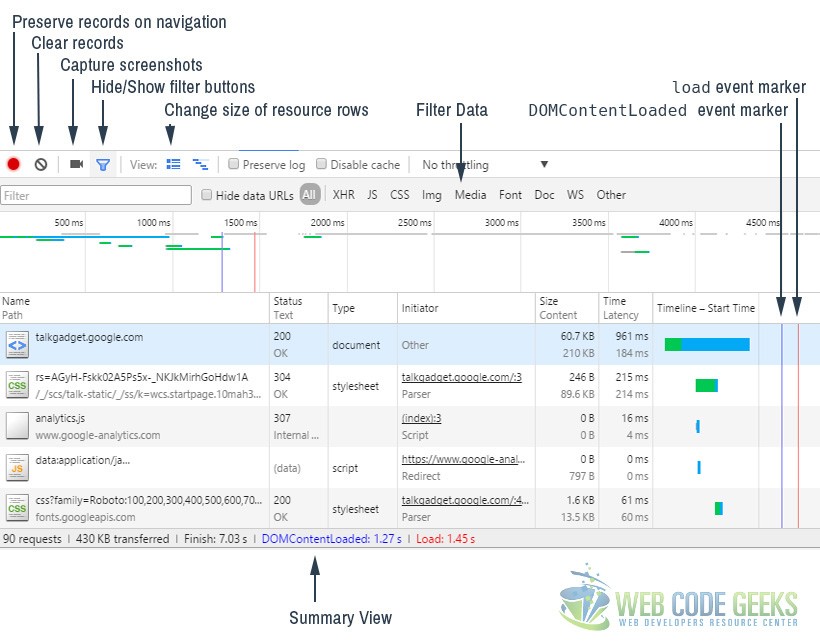
Reload the page to start recording, or simply wait for network activity to occur in your application. Each requested resource is added as a row to the Network table, which contains the columns listed below:
- Name and Path – The name and URL path of the resource, respectively.
- Method – The HTTP method used for the request. For example: GET or POST.
- Status – and Text The HTTP status code and text message.
- Domain – The domain of the resource request.
- Type – The MIME type of the requested resource.
- Initiator – The object or process that initiated the request. It can have one of the following values:
- Parser – Chrome’s HTML parser initiated the request.
- Redirect – A HTTP redirect initiated the request.
- Script – A script initiated the request.
- Other – Some other process or action initiated the request, such as the user navigating to a page via a link, or by entering a URL in the address bar.
- Cookies The number of cookies transferred in the request. These correspond to the cookies shown in the Cookies tab when viewing details for a given resource.
- Set-Cookies The number of cookies set in the HTTP request.
- Size and Content – Size is the combined size of the response headers (usually a few hundred bytes) plus the response body, as delivered by the server. Content is the size of the resource’s decoded content. If the resource was loaded from the browser’s cache rather than over the network, this field will contain the text (from cache).
- Time and Latency – Time is total duration, from the start of the request to the receipt of the final byte in the response. Latency is the time to load the first byte in the response.
- Timeline – The Timeline column displays a visual waterfall of all network requests. Clicking the header of this column reveals a menu of additional sorting fields.
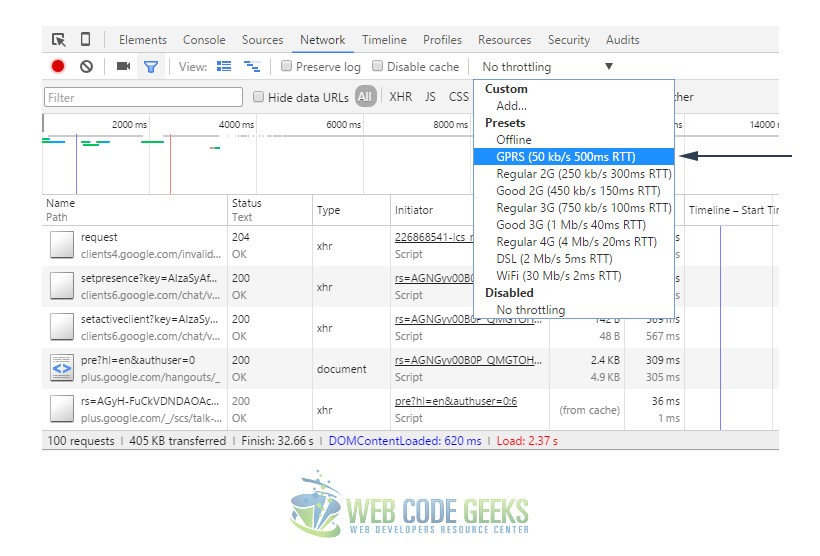
4.2 Network Throttling
This is the case of a network emulator tool inside the dev tools. Network conditioning allows you to test your site on a variety of network connections, including Edge, 3G, and even offline. It throttles the maximum download and upload throughput (rate of data transfer). Latency manipulation enforces a minimum delay in connection round-trip time (RTT).
Network Conditioning is turned on through the Network panel. Select a connection from the dropdown to apply network throttling and latency manipulation.
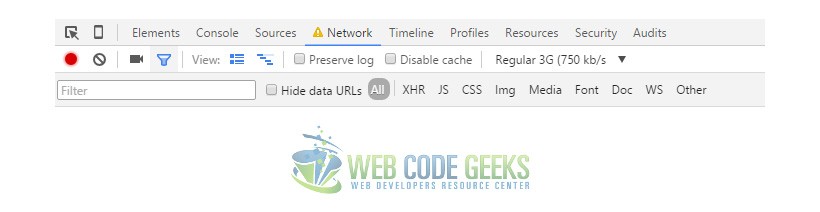
When a Throttle is enabled the panel indicator will show a warning icon. This is to remind you that throttling is enabled when you are in other panels.
5. Timeline
5.1 How to look at performance
Don’t assume performance is as simple as following a simple set of dos and don’ts. Rules can change, and it’s easy to use rules incorrectly. Focus on the user first. How users perceive delays far outweighs any performance guidelines.
RAIL is a user-centric performance model and stands for Response, Animation, Idle, and Load. Learn how to test performance following the RAIL model and using your browser profiling tools.
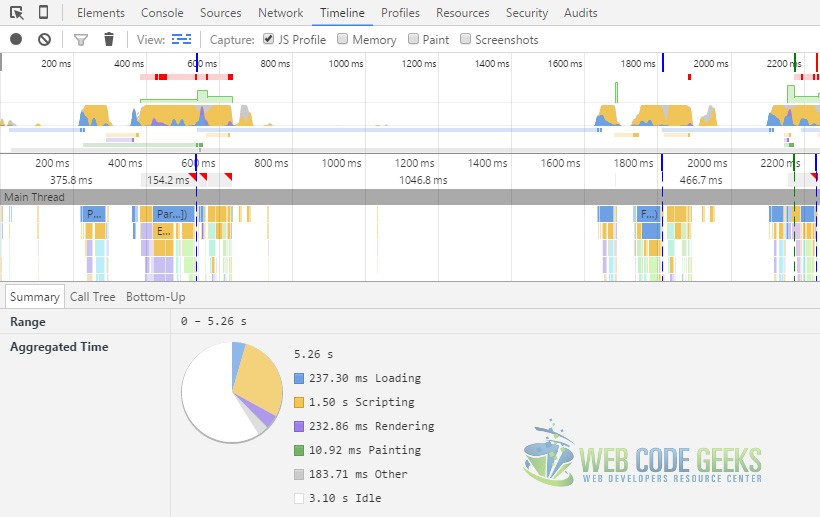
5.2 Analyze Runtime Performance
The simplest way to test JavaScript performance is to view Scripting events in the Chrome DevTools Timeline. If any of the scripting events seem suspiciously long, enable the JS Profile at the top of the Timeline tool:
6. Profiles
Use the Profiles panel if you need more information than the Timeline provide, for instance to track down memory leaks. If you’re noticing jank in your JavaScript, collect a JavaScript CPU profile. CPU profiles show where execution time is spent in your page’s functions.
The sidebar on the left lists your recorded profiles, the tree view on the right shows the information gathered for the selected profile:
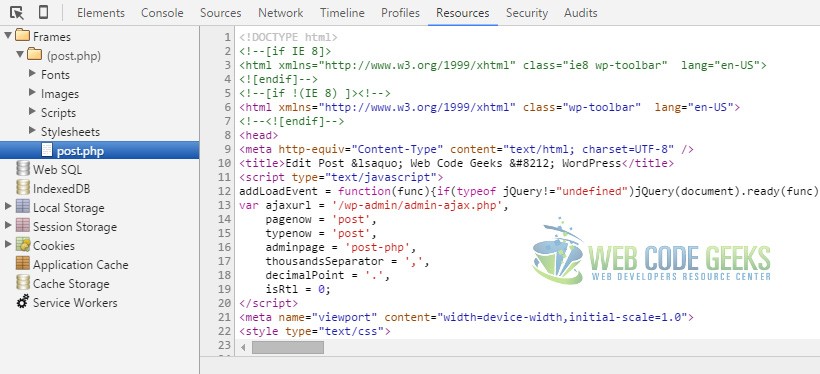
7. Resources
Use the Resources panel to inspect all resources that are loaded, including IndexedDB or Web SQL databases, local and session storage, cookies, Application Cache, images, fonts, and stylesheets.
7.1 Manage Data
Inspect and manage your application’s local data resources using the Chrome Developer Tools Resources panel.
The Resources panel lets you access data sources like IndexedDB and Web SQL databases, cookies, the Application Cache, and local and session storage, as well as page resources like images, fonts, style sheets, and the actual pages, as shown here:
8. Device Mode
Use the Device Mode to build fully responsive, mobile-first web experiences.
8.1 Device Mode
Use Chrome DevTools’ Device Mode to build mobile-first, fully responsive web sites. Learn how to use it to simulate a wide range of devices and their capabilities.
In a nutshell you can:
- Emulate your site across different screen sizes and resolutions, including Retina displays.
- Responsively design by visualizing and inspecting CSS media queries.
- Evaluate your site’s performance using the network emulator, without affecting traffic to other tabs.
- Accurately simulate device input for touch events, geolocation, and device orientation
How to enable Device Mode?
Turn on device mode by pressing the Toggle device mode toggle device mode icon off icon. When device mode is enabled, the icon turns blue and the viewport transforms into a device emulator.
You can also toggle device mode on and off using the keyboard shortcut: Ctrl+Shift+M (or Cmd+Shift+M on Mac).
8.2 Emulate Mobile Viewports
As your mobile audience grows, responsive mobile-friendly web design becomes all the more important. Web content needs to look and feel great across a wide variety of devices and network conditions.
But testing the quality of your mobile experiences on a multitude of devices takes longer and makes debugging more complex. Chrome DevTools’ Device Mode lets you mimic how your development site will look in production on a range of devices.
However, there are some limitations to be considered:
Device hardware
- GPU and CPU behavior are not emulated.
Browser UI
- System displays, such as the address bar, are not emulated.
- Native displays, such as elements, are not emulated as a modal list.
- Some enhancements, such as number inputs opening a keypad, might vary from actual device behavior.
Browser functionality
- WebGL operates in the emulator, but is not supported on iOS 7 devices.
- MathML is not supported in Chrome, but is supported on iOS 7 devices.
- The iOS 5 orientation zoom bug is not emulated.
- The line-height CSS property operates in the emulator, but is not supported in Opera Mini.
- CSS rule limits, such as those in Internet Explorer, are not emulated.
AppCache
- The emulator does not override the UA for AppCache manifest files or view source requests.
Despite these limitations, the Device Mode is robust enough for most tasks.
9. Conclusion
There are endless ways you can test your web project in real-life-like conditions using the Chrome Dev Tools. They provide quite a wide range of tools for analyzing most aspects of your webpage. In addition there are also extra extensions that can be added to provide even further testing tools to make your dev experience more complete. Go ahead and try it yourself to see how much you can achieve.
wonderful article for me to get started with confidence. Thanks !:)