When developing web apps in Visual Studio Code, I find myself using the built-in debugger to conveniently launch my web application in Chrome. Initially I was using the following launch.json configuration to launch Chrome and the debugger:
"configurations": [
    {
      "type": "chrome",
      "request": "launch",
      "name": "Launch Chrome",
      "url": "http://localhost:4200/home",
      "webRoot": "${workspaceFolder}/src"
    }
  ]
This launch configuration works pretty well. It launches a new instance of Chrome pointed to my web application’s URL and connects the debugger.
Over time I have accumulated many Chrome developer extensions. Some of these extensions such as the CORS Toggle extension sometimes need to be turned on and configured while debugging. However, these extensions can interfere with normal web browsing that I may be doing as a I develop. All of a sudden I find myself disabling and re-enabling extensions as I jump between debugging and reading.
The solution… Chrome profiles
Ideally, I would like to have an instance of Chrome open for all my reading alongside a second instance of Chrome for debugging my applications. Each instance should have different extensions with different configurations. The chrome –profile-directory switch allows me to do just that.
To set this up:
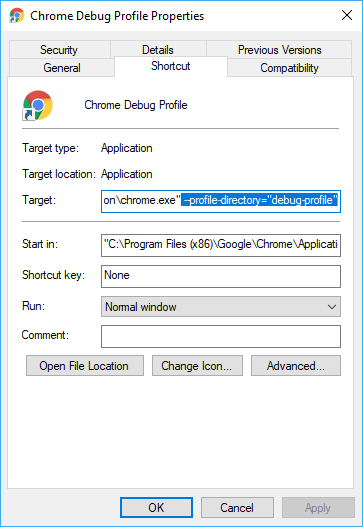
- Create a copy of your chrome browser shortcut and append –profile-directory=”debug-profile” to the Target field:

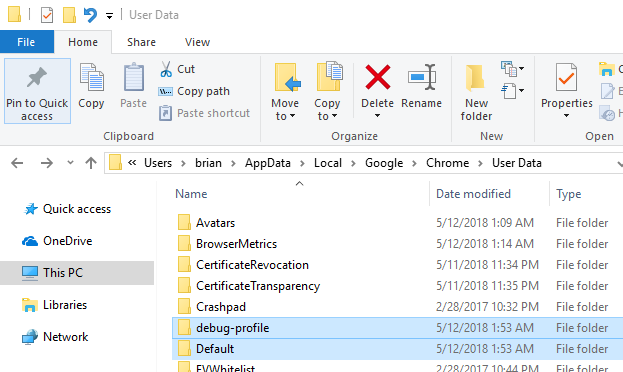
- Double-click your new short-cut to initially create the new profile. Configure this instance of Chrome as you set fit including any development-specific Chrome extensions you use. The new profile by default will be created next to your current profile, for example:

- Update your Visual Studio Code launch.json configuration to include the userDataDir and runtimeArgs properties:
"configurations": [
    {
      "type": "chrome",
      "request": "launch",
      "name": "Launch Chrome",
      "url": "http://localhost:4200/home",
      "webRoot": "${workspaceFolder}/src",
      "userDataDir": false,
      "runtimeArgs": [
        "--profile-directory=debug-profile"
      ]
    }
  ]
The runtimeArgs property instructs Visual Studio Code to launch the Chrome executable with the profile-directory switch set to use the debug profile. The userDataDir property must be set to false since by default Visual Studio Code creates a new temporary profile when launch the Chrome executable and we don’t want that.
Once you have this setup, you are free to customize your Chrome debug-profile as you see fit without fear of impacting your normal browser experience
| Published on Web Code Geeks with permission by Brian De Sousa, partner at our WCG program. See the original article here: Using a Chrome Developer Profile with Visual Studio Code Debugger Opinions expressed by Web Code Geeks contributors are their own. |